- Home
- :
- All Communities
- :
- Products
- :
- Spatial Statistics
- :
- Spatial Statistics Questions
- :
- what is the wrong that make the semivariogram shap...
- Subscribe to RSS Feed
- Mark Topic as New
- Mark Topic as Read
- Float this Topic for Current User
- Bookmark
- Subscribe
- Mute
- Printer Friendly Page
what is the wrong that make the semivariogram shape has many lines, not just one line?
- Mark as New
- Bookmark
- Subscribe
- Mute
- Subscribe to RSS Feed
- Permalink
- Report Inappropriate Content
what is the wrong that make the semivariogram shape has many lines, not just one line?
Solved! Go to Solution.
Accepted Solutions
- Mark as New
- Bookmark
- Subscribe
- Mute
- Subscribe to RSS Feed
- Permalink
- Report Inappropriate Content
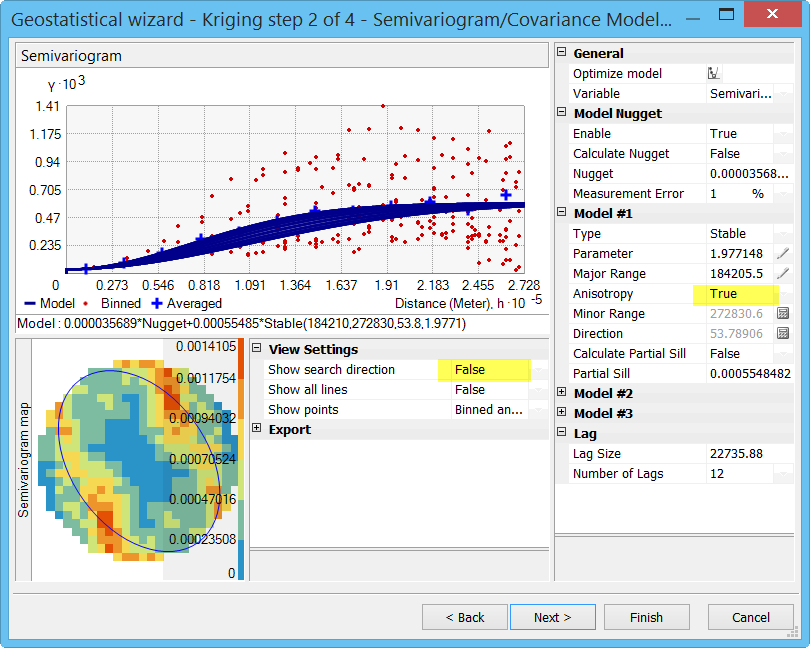
There are actually two different visualizations that can create many lines.
The first is anisotropy. You'll see many semivariograms based on directional distance if you turn "Anisotropy" to True and "Show search direction" to False, as in this graphic:
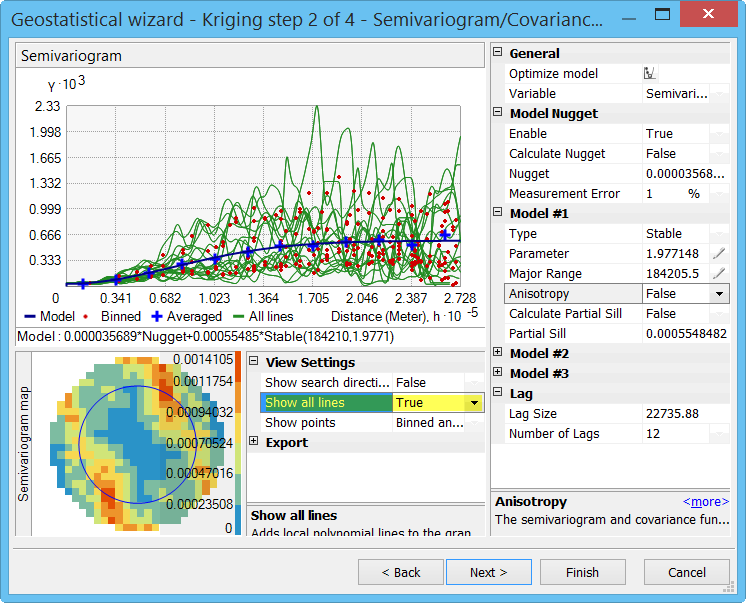
The second way is the "Show all lines" option that shows all directional local polynomials in Local Polynomial Interpolation (the idea is that the semivariograms should pass through the middle of these polynomials):
- Mark as New
- Bookmark
- Subscribe
- Mute
- Subscribe to RSS Feed
- Permalink
- Report Inappropriate Content
what were you doing? what tool(s) what process?
this is the traditional view Understanding a semivariogram: The range, sill, and nugget—Help | ArcGIS for Desktop
could you please include an image of what you obtained and how you obtained it
- Mark as New
- Bookmark
- Subscribe
- Mute
- Subscribe to RSS Feed
- Permalink
- Report Inappropriate Content
There are actually two different visualizations that can create many lines.
The first is anisotropy. You'll see many semivariograms based on directional distance if you turn "Anisotropy" to True and "Show search direction" to False, as in this graphic:
The second way is the "Show all lines" option that shows all directional local polynomials in Local Polynomial Interpolation (the idea is that the semivariograms should pass through the middle of these polynomials):