- Home
- :
- All Communities
- :
- Developers
- :
- JavaScript Maps SDK
- :
- JavaScript Maps SDK Questions
- :
- javascript api user defined symbology
- Subscribe to RSS Feed
- Mark Topic as New
- Mark Topic as Read
- Float this Topic for Current User
- Bookmark
- Subscribe
- Mute
- Printer Friendly Page
- Mark as New
- Bookmark
- Subscribe
- Mute
- Subscribe to RSS Feed
- Permalink
- Report Inappropriate Content
Greetings,
I have a nice little ESRI Javascript API application pointed at an ArcGIS Server instance. The client would like to change the symbology of any given feature in the application. They have the ability to turn on and off multiple layers but sometimes the users want the ability to change symbology in the event that the symbology looks bad when combined. Is there any way to give the user the ability do define the colors of the renderer using a color picker or something?
Thanks, Tyler
Solved! Go to Solution.
Accepted Solutions
- Mark as New
- Bookmark
- Subscribe
- Mute
- Subscribe to RSS Feed
- Permalink
- Report Inappropriate Content
Yeeup, that's the basic idea. I've done this in one of my apps that has a graphicsLayer that contains user sketched graphics on the map:
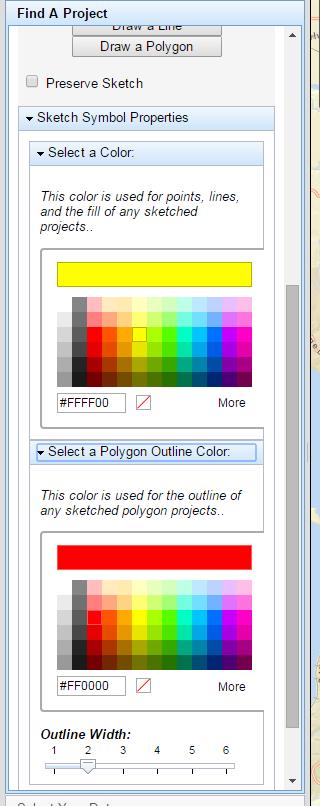
It's basically two ColorPicker widgets and utilize the color-change event to update a symbol that the layer's renderer uses.
        var pickerOutline = new ColorPicker({
            color: "#ff0000",
            showRecentColors: false,
            showTransparencySlider: false
        }, "clrOutline");
        pickerOutline.startup();


        pickerOutline.on("color-change", function(evt) {
            var theOutline = fillSymbol.outline;
            theOutline.color = pickerOutline.color;
            fillSymbol.setOutline(theOutline);


            theGLayer.redraw();
        });

        var pickerFill = new ColorPicker({
            color: "#FFFF00",
            showRecentColors: false,
            showTransparencySlider: false
        }, "clrFill");
        pickerFill.startup();

        pickerFill.on("color-change", function(evt) {
            if(evt.color.toString() === "no-color") {
                fillSymbol.setStyle(SimpleFillSymbol.STYLE_NULL);
            } else {
                fillSymbol.setStyle(SimpleFillSymbol.STYLE_SOLID);
                fillSymbol.color = pickerFill.color;
            }
            lineSymbol.color = pickerFill.color;
            theGLayer.redraw();
        });
- Mark as New
- Bookmark
- Subscribe
- Mute
- Subscribe to RSS Feed
- Permalink
- Report Inappropriate Content
Yeeup, that's the basic idea. I've done this in one of my apps that has a graphicsLayer that contains user sketched graphics on the map:
It's basically two ColorPicker widgets and utilize the color-change event to update a symbol that the layer's renderer uses.
        var pickerOutline = new ColorPicker({
            color: "#ff0000",
            showRecentColors: false,
            showTransparencySlider: false
        }, "clrOutline");
        pickerOutline.startup();


        pickerOutline.on("color-change", function(evt) {
            var theOutline = fillSymbol.outline;
            theOutline.color = pickerOutline.color;
            fillSymbol.setOutline(theOutline);


            theGLayer.redraw();
        });

        var pickerFill = new ColorPicker({
            color: "#FFFF00",
            showRecentColors: false,
            showTransparencySlider: false
        }, "clrFill");
        pickerFill.startup();

        pickerFill.on("color-change", function(evt) {
            if(evt.color.toString() === "no-color") {
                fillSymbol.setStyle(SimpleFillSymbol.STYLE_NULL);
            } else {
                fillSymbol.setStyle(SimpleFillSymbol.STYLE_SOLID);
                fillSymbol.color = pickerFill.color;
            }
            lineSymbol.color = pickerFill.color;
            theGLayer.redraw();
        });
- Mark as New
- Bookmark
- Subscribe
- Mute
- Subscribe to RSS Feed
- Permalink
- Report Inappropriate Content
Thanks a ton. I changed it around a little and swapped out the legend items with spectrum.js colorpickers and it works like a charm.
- Mark as New
- Bookmark
- Subscribe
- Mute
- Subscribe to RSS Feed
- Permalink
- Report Inappropriate Content
You can also fully change the renderer for a featureLayer as well. Here's another example where I'm changing the renderer for a USGS earthquake feed to have more levels of symbology (and custom icons):
        var theUsgsEarthquakeLayer = new FeatureLayer("http://igems.doi.gov/arcgis/rest/services/igems_haz/MapServer/3", {
          id: "quakes",
          mode: FeatureLayer.MODE_ONDEMAND,
          refreshInterval: 5,
          autoGeneralize: false,
          outFields: ["*"]
        });

        if (theUsgsEarthquakeLayer != null) {
            //define a popup template
            var usgsQuakeTemplate = new InfoTemplate();
            usgsQuakeTemplate.setContent(formatQuakeContent);
            usgsQuakeTemplate.setTitle("Magnitude ${magnitude} Earthquake");
            theUsgsEarthquakeLayer.setInfoTemplate(usgsQuakeTemplate);
            theUsgsEarthquakeLayer.setAutoGeneralize(false);
            //Create a different renderer with new symbols
            var renderer = new ClassBreaksRenderer(null, "magnitude");
            renderer.addBreak(0, 3, blueMarkerSymb);
            renderer.addBreak(3, 5, greenMarkerSymb);
            renderer.addBreak(5, 7, orangeMarkerSymb);
            renderer.addBreak(7, 9, redMarkerSymb);
            renderer.addBreak(9, Infinity, purpleMarkerSymb);


            theUsgsEarthquakeLayer.setRenderer(renderer);
        } else {
            // Define the USGS Earthquake layer retrieved from a KML file instead
            theUsgsEarthquakeLayer = new KMLLayer("http://earthquake.usgs.gov/earthquakes/feed/v1.0/summary/1.0_week_age_link.kml", {
                id: 'quakes',
                refreshInterval: 5,
                visible: true
            });
        }