- Home
- :
- All Communities
- :
- Products
- :
- Spatial Data Science
- :
- Spatial Data Science Questions
- :
- Heat Map Creation
- Subscribe to RSS Feed
- Mark Topic as New
- Mark Topic as Read
- Float this Topic for Current User
- Bookmark
- Subscribe
- Mute
- Printer Friendly Page
Heat Map Creation
- Mark as New
- Bookmark
- Subscribe
- Mute
- Subscribe to RSS Feed
- Permalink
- Report Inappropriate Content
I'm currently in the process of creating a heat map and have attempted to use, Kernel, Point, Cluster & Outlier, Hot Spot Analysis and finally Optimized Hot Spot, but unfortunately all do not produce the desired effect.
I have around 1900 data points currently placed on my map (around 3km by 1.5km). They all lie on 1 of 23 points (I believe this to be the problem, as they obviously overlap on the same grid reference). When I use one of the above methods they all produce overlap rather than a spread out heat effect which I am looking for. Is there anyway to fan out one of these analysis techniques that will produce the effect I'm after? Some points have 500+ where as a couple have only 1. (I've attached the current layout in a jpeg)
Any help would be greatly appreciated.
Martin
- Mark as New
- Bookmark
- Subscribe
- Mute
- Subscribe to RSS Feed
- Permalink
- Report Inappropriate Content
there are tools to disperse points... but that would be fudging.
Why are all the points stacked?
Why don't you summarize by location?
You do have lots of points... but you are really lacking a dense enough pattern
Why have you narrowed in on heat map? why not an areal representation of the data like a Voronoi diagram/Delaunay triangulation or some other form of spatial allocation ( I know... heat maps are cool this year... like Pokemon)
Any more info as to what data you have and what you are trying to show would be useful
- Mark as New
- Bookmark
- Subscribe
- Mute
- Subscribe to RSS Feed
- Permalink
- Report Inappropriate Content
Thanks for the swift reply Dan.
The data was collected by rounding to the closest of the 23 locations and not by actual GPS points (not my data collection, but it is unfortunately what I've got to work with).
The objective is to show locations frequented in a wildlife park through out the summer months and from a quick sketch they appear to cluster around a central focal point which this is why I thought about a heat map.
I'm quite new to ArcGIS, however thanks for highlighting the Voronoi diagram/Delaunay. I'll look into both methods and get back.
Thanks again.
- Mark as New
- Bookmark
- Subscribe
- Mute
- Subscribe to RSS Feed
- Permalink
- Report Inappropriate Content
I wrote Triangulation Tools, but you need a shapefile as input and output
- Mark as New
- Bookmark
- Subscribe
- Mute
- Subscribe to RSS Feed
- Permalink
- Report Inappropriate Content
Trying to use the disperse markers tool, but when attempting to to drop the exported data, it says:
'One or more dropped items were invalid and will not be added to the control'.
The files are point features with markers, but is there something else that is needed in this method.
Cheers
- Mark as New
- Bookmark
- Subscribe
- Mute
- Subscribe to RSS Feed
- Permalink
- Report Inappropriate Content
that disperses markers... you want to disperse points (Tom Dilts) a subtle but important difference.
AND you should perform a summary on your points to get a count per location prior to doing a voronoi should you go that route, then add a field in the voronoi table and add the attributes in... alternately, do the voronoi and then a spatial join of the points to get the counts.
- Mark as New
- Bookmark
- Subscribe
- Mute
- Subscribe to RSS Feed
- Permalink
- Report Inappropriate Content
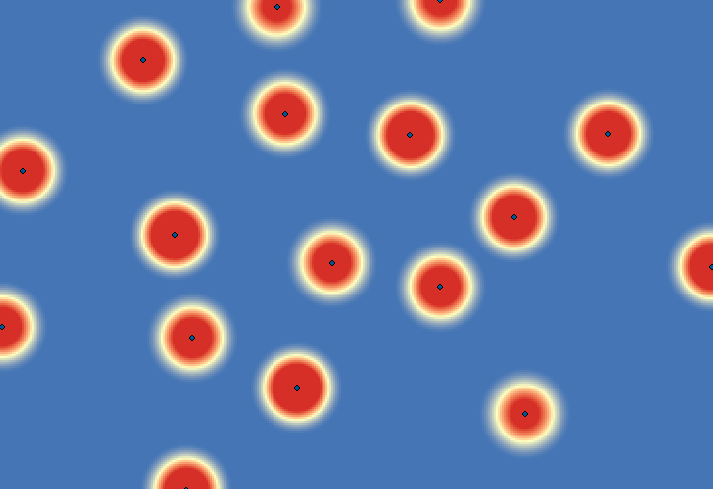
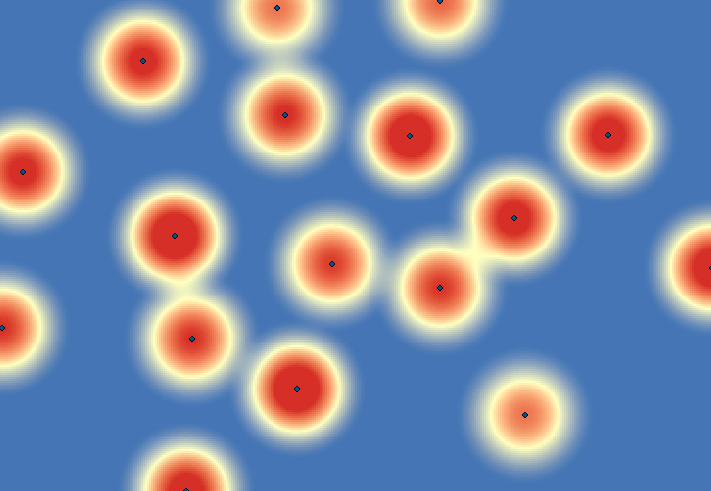
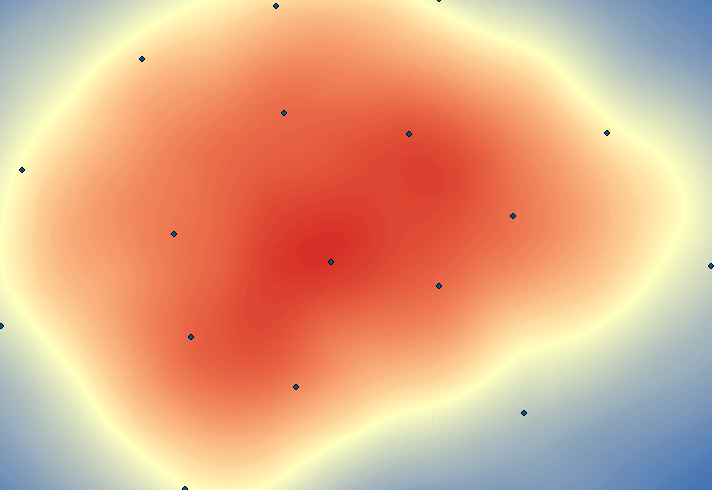
Can you show your point density result? You can get huge variety of effects just by changing the tool parameters.
Here are several examples using the same dataset, just changing value of search radius in Kernel Density:


etc.
- Mark as New
- Bookmark
- Subscribe
- Mute
- Subscribe to RSS Feed
- Permalink
- Report Inappropriate Content
but the real data is in the stack of points at each location unfortunately, not just the existing point distribution
- Mark as New
- Bookmark
- Subscribe
- Mute
- Subscribe to RSS Feed
- Permalink
- Report Inappropriate Content
So is mine.
- Mark as New
- Bookmark
- Subscribe
- Mute
- Subscribe to RSS Feed
- Permalink
- Report Inappropriate Content
but his points are erroneously stacked, so all you can really do is divide the space between the aggregated locations as ascribe the summary to that space. Better still, would be to ascribe it to blocks (like a sidewalk section) and leave the locations where points aren't possible as no data. It is a case of having to deal with a bad situation, but convey the information realistically