- Home
- :
- All Communities
- :
- Products
- :
- ArcGIS Online
- :
- ArcGIS Online Questions
- :
- time slider labels
- Subscribe to RSS Feed
- Mark Topic as New
- Mark Topic as Read
- Float this Topic for Current User
- Bookmark
- Subscribe
- Mute
- Printer Friendly Page
time slider labels
- Mark as New
- Bookmark
- Subscribe
- Mute
- Subscribe to RSS Feed
- Permalink
- Report Inappropriate Content
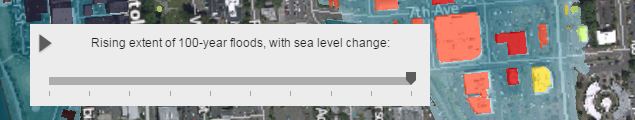
I'm trying to build a story map that shows sea level rise, using the map journal template and an embedded Time Aware web map . The time slider plays out the mounting levels of rise and looks good. My problem is the specific levels are very hard to distinguish because there are no labels on the time slider showing which level you are at (14ft NAVD, 14.5ft NAVD, etc).
It seems the only formats available are date/time, and i can't figure out a way to adapt normal numbers into the date/time options available (especially since I have one level that is a 3-digit decimal). Any ideas?
*the field i'm using to drive the time slider is a 4-digit numeric. i made the levels look like years so it would ascend properly. ex: 1400, 1450, 1500...
- Mark as New
- Bookmark
- Subscribe
- Mute
- Subscribe to RSS Feed
- Permalink
- Report Inappropriate Content
Hi Kira,
Can you share your app or web map? How is your sea level data displayed? Vector or raster data
Would labeling or adding a legend help to display this data?
Thanks,
Kelly
- Mark as New
- Bookmark
- Subscribe
- Mute
- Subscribe to RSS Feed
- Permalink
- Report Inappropriate Content
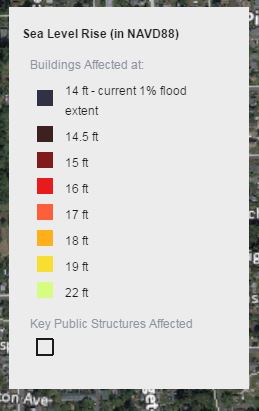
The data is displayed in polygons showing areas inundated by flooding, and polygons showing buildings affected by the flooding. The area covered by flooding and the structures affected expand as the slider moves right.
I tried using labels, and also have a legend showing the levels of rise, but remains pretty counterintuitive to have a timeline bar without labeling, asking people to either count the bars or guess what each level is. The info in the legend is what i would like to be able to incrementally display on the slider.
Thanks for any input!