- Home
- :
- All Communities
- :
- Developers
- :
- Open Source Mapping Libraries
- :
- Open Source Mapping Libraries Ques.
- :
- Adding Map Services with Custom Tiling Schemes to ...
- Subscribe to RSS Feed
- Mark Topic as New
- Mark Topic as Read
- Float this Topic for Current User
- Bookmark
- Subscribe
- Mute
- Printer Friendly Page
Adding Map Services with Custom Tiling Schemes to Leaflet
- Mark as New
- Bookmark
- Subscribe
- Mute
- Subscribe to RSS Feed
- Permalink
- Report Inappropriate Content
I have been developing data visualization web mapping applications for various Cumberland County departments using the Leaflet JavaScript library. All of these apps have used the standard WGS84 Web Mercator Auxiliary Sphere projection/tiling scheme. This is used in Google Maps, ArcGIS Online, and the other major web map players.
And while this works just fine, I wondered if there was a way to build web maps using the custom projection and tiling scheme we use for our tiled map services. It turns out there is - but it requires a few plugins.
The first is Proj4js, which “ transform point coordinates from one coordinate system to another, including datum transformations.”
The second is Proj4Leaflet, which “makes it possible to use projections and CRS not built into Leaflet.” CRS stands for Coordinate Reference System.
I thought I would share the process for using Esri REST services with custom projections/tiling schemes in a Leaflet web map. You can find the example on CodePen.
When I was learning how to do this, I referenced the example from the Esri Leaflet documentation site. We’ll use Cumberland County’s 2015 Existing Land Use service for this demo.
The service uses the Pennsylvania State Plane South (ft) projection, or EPSG 2272 as it is also known. The spatial reference for your Esri REST service can be found at the service’s endpoint URL.
You can get the information for your specific projection from the Spatial Reference website. Here is sample of what you’ll get from this website to construct the custom CRS for your service:
+proj=lcc +lat_1=40.96666666666667 +lat_2=39.93333333333333 +lat_0=39.33333333333334 +lon_0=-77.75 +x_0=600000 +y_0=0 +ellps=GRS80 +datum=NAD83 +to_meter=0.3048006096012192 +no_defs
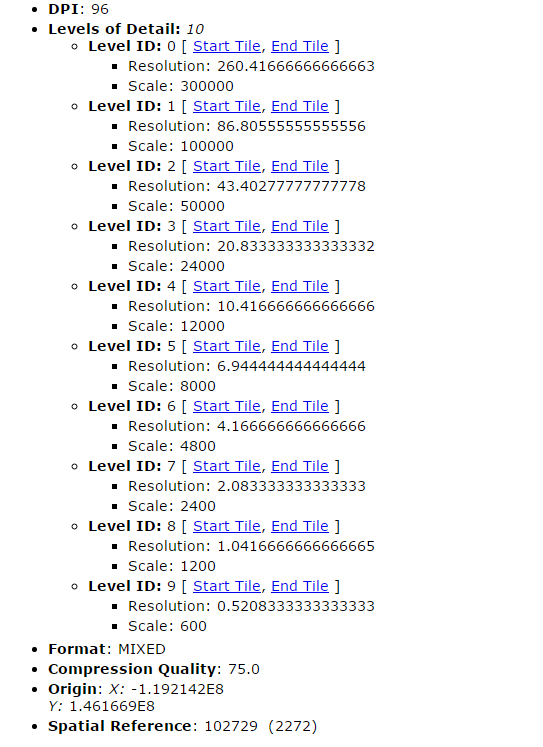
We also need some information about the service itself. This includes the origin, and resolution for each zoom level. These can also be found at the service’s endpoint URL. Below is an image showing where this information is located:
Here is the code snippet for creating the custom CRS for the Existing Land Use service:
var spcPACrs = new L.Proj.CRS(
'EPSG:2272',
'+proj=lcc +lat_1=40.96666666666667 +lat_2=39.93333333333333 +lat_0=39.33333333333334 +lon_0=-77.75 +x_0=600000 +y_0=0 +ellps=GRS80 +datum=NAD83 +to_meter=0.3048006096012192 +no_defs', {
origin: [-1.192142E8, 1.461669E8],
resolutions: [
260.41666666666663,
86.80555555555556,
43.40277777777778,
20.833333333333332,
10.416666666666666,
6.944444444444444,
4.166666666666666,
2.083333333333333,
1.0416666666666665,
0.5208333333333333
]
});
Now that we have created our custom CRS, we can construct the service. We will be using the tiledMapLayer class from the Esri Leaflet library. It should be noted that by default, you can only use this class for tiled map services that use the WGS84 Web Mercator Auxiliary Sphere projection. You need the above referenced plugins to use other projections/tiling schemes.
var ccpaELU = L.esri.tiledMapLayer({
url: '//gis.ccpa.net/arcgiswebadaptor/rest/services/ELU/MapServer',
maxZoom: 8,
minZoom: 0,
continuousWorld: true,
attribution: 'Cumberland County',
errorTileUrl: '//downloads2.esri.com/support/TechArticles/blank256.png'
}).addTo(map);
Some of the options you can set are the minimum and maximum zoom levels for the service. The numbers should match the Level ID numbers found at the service’s endpoint URL. You also have options to set an image for any places where the tiles fail to load. As the tiledMapLayer inherits from Leaflet’s tileLayer class, all of it’s options can be used with the tiledMapLayer.
Hopefully you have found this article helpful. To see this example in action, please visit the CodePen site.
- Mark as New
- Bookmark
- Subscribe
- Mute
- Subscribe to RSS Feed
- Permalink
- Report Inappropriate Content
very cool patrick!