- Home
- :
- All Communities
- :
- Developers
- :
- JavaScript Maps SDK
- :
- JavaScript Maps SDK Questions
- :
- popupTemplate when loading WebMap
- Subscribe to RSS Feed
- Mark Topic as New
- Mark Topic as Read
- Float this Topic for Current User
- Bookmark
- Subscribe
- Mute
- Printer Friendly Page
- Mark as New
- Bookmark
- Subscribe
- Mute
- Subscribe to RSS Feed
- Permalink
- Report Inappropriate Content
Is it possible to use the Popup Template when loading a WebMap ?
The Popup Template sample code is built in the context of loading a feature layer, but not an entire WebMap.
The sample code when loading a feature layer is
var featureLayer = new FeatureLayer({
url: "..."
popupTemplate: {
mediaInfos: [{ ... }]
}
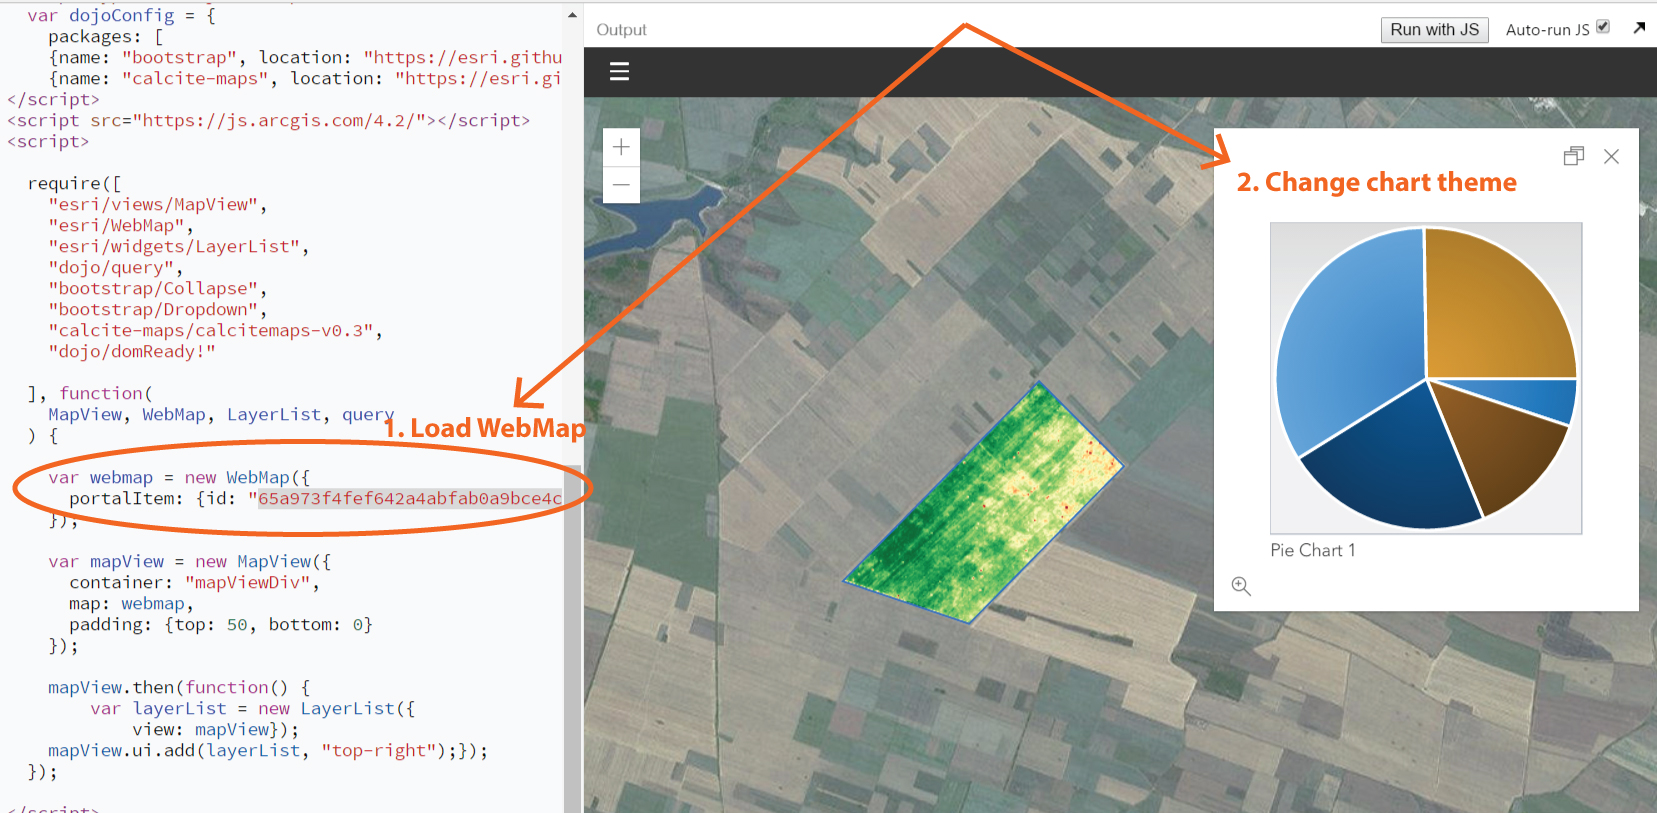
})but how do you use the popupTemplate when loading a WebMap with feature & tile layers ?
var webmap = new WebMap({
portalItem: {id: "..."}
})My WebApp is available on JS BIN.
Michelle.
Solved! Go to Solution.
Accepted Solutions
- Mark as New
- Bookmark
- Subscribe
- Mute
- Subscribe to RSS Feed
- Permalink
- Report Inappropriate Content
I think your best bet would be to edit the popup theme elsewhere, as Robert mentioned. I don't know a lot about what goes into setting up these kinds of popups, but you're probably better off editing it in the application that was used to create the web map and define the pie chart in the first place.
Edit: this turns out to simpler than I thought.
You can change the chart theme like this: JS Bin - Collaborative JavaScript Debugging
You can totally remake the chart, which includes redefining which fields get charted like this: JS Bin - Collaborative JavaScript Debugging
- Mark as New
- Bookmark
- Subscribe
- Mute
- Subscribe to RSS Feed
- Permalink
- Report Inappropriate Content
Michelle,
From the docs:
You can configure pop-ups in ArcGIS Server service layers, hosted feature layers, hosted tile layers, layers from files, and OGC WMS and WFS layers. If you are configuring pop-ups for an ArcGIS Server feature layer, you can also set which fields are editable. If your layers contain related data, you can configure pop-ups to show the related data within the pop-up or in a table.
- Mark as New
- Bookmark
- Subscribe
- Mute
- Subscribe to RSS Feed
- Permalink
- Report Inappropriate Content
From the documentation it is my understanding that you can use the popupTemplate when loading a WebMap. But I can not seem to find a sample code.
I updated my question to make it a little more precise.
- Mark as New
- Bookmark
- Subscribe
- Mute
- Subscribe to RSS Feed
- Permalink
- Report Inappropriate Content
Michelle,
If you are configuring your popups in the web map using the AGOL map viewer, then you do not have to worry about the popup template stuff. You configure the popup using the map viewer GUI, which allows and the options like charts and images.
- Mark as New
- Bookmark
- Subscribe
- Mute
- Subscribe to RSS Feed
- Permalink
- Report Inappropriate Content
Thank you rscheitlin
- Mark as New
- Bookmark
- Subscribe
- Mute
- Subscribe to RSS Feed
- Permalink
- Report Inappropriate Content
What do you mean by "use the popup template?" In other words, what's your goal here?
You can set the popup template per layer using the popupTemplate property, as in the sample you linked. You can also set the popup template on a MapView or a SceneView using the popup property. In the case of your app, it would be a MapView: MapView | API Reference | ArcGIS API for JavaScript 4.3
- Mark as New
- Bookmark
- Subscribe
- Mute
- Subscribe to RSS Feed
- Permalink
- Report Inappropriate Content
Hi Thomas,
My goal is to load a WebMap and then customize it's feature layer popup in order to set up a certain dojox charting theme.
The code above is available on JS BIN.
Can I do that using the popupTemplate?
popupTemplate: {
mediaInfos: [{
value:{
theme: "..." }
}]
}If so, could you provide me a sample code? I can't seem to get this code working in my JS BIN.
Michelle.
- Mark as New
- Bookmark
- Subscribe
- Mute
- Subscribe to RSS Feed
- Permalink
- Report Inappropriate Content
I think your best bet would be to edit the popup theme elsewhere, as Robert mentioned. I don't know a lot about what goes into setting up these kinds of popups, but you're probably better off editing it in the application that was used to create the web map and define the pie chart in the first place.
Edit: this turns out to simpler than I thought.
You can change the chart theme like this: JS Bin - Collaborative JavaScript Debugging
You can totally remake the chart, which includes redefining which fields get charted like this: JS Bin - Collaborative JavaScript Debugging
- Mark as New
- Bookmark
- Subscribe
- Mute
- Subscribe to RSS Feed
- Permalink
- Report Inappropriate Content
Thomas Solow this is really beautiful, works like a charm 
Is there something I should be doing regarding the tooltipField ?
The chart doesn't seem to be responsive on hover.
Michelle.
- Mark as New
- Bookmark
- Subscribe
- Mute
- Subscribe to RSS Feed
- Permalink
- Report Inappropriate Content
The API documentation says tooltipField is "Used for chart values. Defines the tooltip display field that displays when hovering over the chart."
I'm not sure what it actually does though. I couldn't get anything to happen when hovering my mouse over the chart while changing that value. I think it should be set to the name of one of the fields being used to construct the pie graph but I tried this and didn't notice a change.