- Home
- :
- All Communities
- :
- Products
- :
- ArcGIS Spatial Analyst
- :
- ArcGIS Spatial Analyst Questions
- :
- Shrinks the selected zones by a specified number o...
- Subscribe to RSS Feed
- Mark Topic as New
- Mark Topic as Read
- Float this Topic for Current User
- Bookmark
- Subscribe
- Mute
- Printer Friendly Page
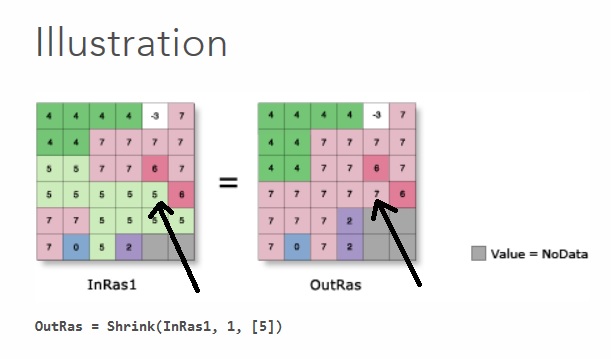
Shrinks the selected zones by a specified number of cells by replacing them with the value of the cell that is most frequent in its neighborhood. What about a tie?
- Mark as New
- Bookmark
- Subscribe
- Mute
- Subscribe to RSS Feed
- Permalink
- Report Inappropriate Content
Can somebody please help clarify how exactly the Shrink tool replaces cells with the pixel value that is most frequent in its neighborhood? From what I gather in the help file, the tool assigns the neighborhood as the 8 cells surrounding it. There is no mention on how the tool deals with a tie in frequency (for example: In the case of tie, the lower value is used when running the Point Statistics tool to calculate the Majority). Furthermore, the illustrated example found within the help file does not make this any clearer. I have uploaded the illustration and have highlighted a particular cell value with an arrow. I don't understand how this cell was assigned a value of 7 rather than a value of 6. What are the rules that resulted in this cell being assigned a value of 6. Thanks in advance.
- Mark as New
- Bookmark
- Subscribe
- Mute
- Subscribe to RSS Feed
- Permalink
- Report Inappropriate Content
'first found' ... similar to the rules applied when generating RegionGroup ...