- Home
- :
- All Communities
- :
- Developers
- :
- JavaScript Maps SDK
- :
- JavaScript Maps SDK Questions
- :
- Changing theme in ESRI tutorial
- Subscribe to RSS Feed
- Mark Topic as New
- Mark Topic as Read
- Float this Topic for Current User
- Bookmark
- Subscribe
- Mute
- Printer Friendly Page
- Mark as New
- Bookmark
- Subscribe
- Mute
- Subscribe to RSS Feed
- Permalink
- Report Inappropriate Content
Hi everybody,
Two questions regarding a ESRI tutorial.
1) The tutorial uses a Wetland theme for it's dojox charts.
var theme = "Wetland"; This is Wetland.js (from dojox website😞
define(["../SimpleTheme", "./common"], function(SimpleTheme, themes){
themes.Wetland = new SimpleTheme({
colors: [
"#bfbc64",
"#737130",
"#73373b",
"#7dafca",
"#8d3c42"
]
});
return themes.Wetland;
});I would like to replace Wetland.js with my own customTheme.js. But I cannot manage to reference the external file customTheme.js
Any support with a sample code (compatible with the tutorial code) would be very helpful.
2) The links in Wetland.js reference local stored files:
define(["../SimpleTheme", "./common"]Do I need to replace these with http:// links in order to create a customTheme.js file?
Thank you,
Michelle
Solved! Go to Solution.
Accepted Solutions
- Mark as New
- Bookmark
- Subscribe
- Mute
- Subscribe to RSS Feed
- Permalink
- Report Inappropriate Content
Michelle,
Attached is a working example.
It is just a matter of properly referencing the theme file in your code:
<script type="text/javascript">
var dojoConfig = {
packages: [{
name: "themes",
location: location.pathname.replace(/\/[^/]+$/, '') + "/themes"
}]
};
</script>and setting a more complete path to the dojox libraries in your theme code:
define([
"dojox/charting/SimpleTheme",
"dojox/charting/themes/common"
], function(SimpleTheme, themes){
themes.MyTheme = new SimpleTheme({
colors: [
"#FF0000",
"#e0e860",
"#0000FF",
"#999999",
"#636563"
]
});
return themes.MyTheme;
});
- Mark as New
- Bookmark
- Subscribe
- Mute
- Subscribe to RSS Feed
- Permalink
- Report Inappropriate Content
Thank you for your time Robert Scheitlin, GISP
Your sample is very useful for coding future references.
Playing with the chart I found that if you swap the contents between tab1 - tab2, the chart will not render.
Is this a bug in the code?
var cp1 = new ContentPane({
title: "Pie Chart"
});
var cp2 = new ContentPane({
title: "Details",
...
});
cp1.set("content", chart.node);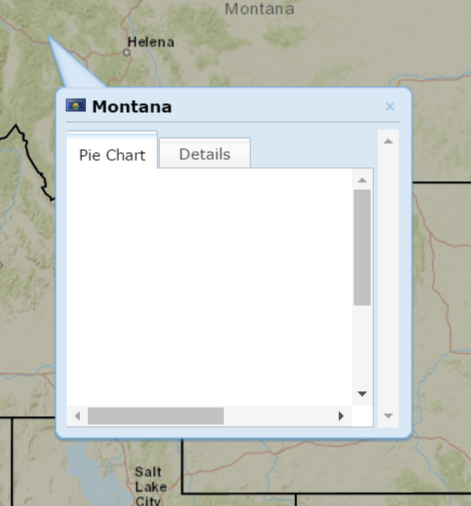
- Mark as New
- Bookmark
- Subscribe
- Mute
- Subscribe to RSS Feed
- Permalink
- Report Inappropriate Content
Michelle,
You need to resize the chart to get it to render in the first tab like this (line 63 to 65):
function getWindowContent(graphic) {
// Make a tab container.
var tc = new TabContainer({
style: "width:100%;height:100%;"
}, domConstruct.create("div"));
// Display attribute information.
var cp1 = new ContentPane({
title: "Details",
content: "<a target='_blank' href='https://en.wikipedia.org/wiki/" +
graphic.attributes.STATE_NAME + "'>Wikipedia Entry</a><br><br>Median Age: " +
graphic.attributes.MED_AGE + "<br>Median Age (Male): " +
graphic.attributes.MED_AGE_M + "<br>Median Age (Female): " +
graphic.attributes.MED_AGE_F
});
// Display a dojo pie chart for the male/female percentage.
var cp2 = new ContentPane({
title: "Pie Chart"
});
tc.addChild(cp2);
tc.addChild(cp1);
// Create the chart that will display in the second tab.
var c = domConstruct.create("div", {
id: "demoChart"
}, domConstruct.create("div"));
var chart = new Chart2D(c);
domClass.add(chart, "chart");
// Apply a color theme to the chart.
chart.setTheme(myTheme);
chart.addPlot("default", {
type: "Pie",
radius: 70,
htmlLabels: true
});
tc.watch("selectedChildWidget", function(name, oldVal, newVal){
if ( newVal.title === "Pie Chart" ) {
chart.resize(180,180);
}
});
// Calculate percent male/female.
var total = graphic.attributes.POP2000;
var male = number.round(graphic.attributes.MALES / total * 100, 2);
var female = number.round(graphic.attributes.FEMALES / total * 100, 2);
chart.addSeries("PopulationSplit", [{
y: male,
tooltip: male,
text: "Male"
}, {
y: female,
tooltip: female,
text: "Female"
}]);
//highlight the chart and display tooltips when you mouse over a slice.
new Highlight(chart, "default");
new Tooltip(chart, "default");
new MoveSlice(chart, "default");
cp2.set("content", chart.node);
setTimeout(function(){
chart.resize(180,180);
}, 200);
return tc.domNode;
}- Mark as New
- Bookmark
- Subscribe
- Mute
- Subscribe to RSS Feed
- Permalink
- Report Inappropriate Content
Working great,
Thank you Robert 
- Mark as New
- Bookmark
- Subscribe
- Mute
- Subscribe to RSS Feed
- Permalink
- Report Inappropriate Content
Hi Robert Scheitlin, GISP ,
I used the script referencing the theme file
<script type="text/javascript">
var dojoConfig = {
packages: [{
name: "themes",
location: location.pathname.replace(/\/[^/]+$/, '') + "/themes"
}]
};
</script>but when introducing this code line
chart1.setTheme(MyTheme);the chart stops working.
And I do not understand why 
Thank you,
Michelle
- Mark as New
- Bookmark
- Subscribe
- Mute
- Subscribe to RSS Feed
- Permalink
- Report Inappropriate Content
Michelle,
You have a couple of issue in your code. You need to add the theme package to the existing dojo config package list and not add another dojoConfig. Next you never added the myTheme to your require list (lines 88 and 95):
<!DOCTYPE html>
<html lang="en">
<head>
<meta charset="utf-8">
<meta http-equiv="X-UA-Compatible" content="IE=edge">
<meta name="viewport" content="width=device-width,initial-scale=1,maximum-scale=1,user-scalable=no">
<link rel="stylesheet" href="http://esri.github.io/calcite-maps/dist/css/calcite-maps-bootstrap.min-v0.3.css">
<link rel="stylesheet" href="http://esri.github.io/calcite-maps/dist/css/calcite-maps-arcgis-3.x.min-v0.3.css">
<link rel="stylesheet" href="http://js.arcgis.com/3.20/esri/themes/calcite/dijit/calcite.css">
<link rel="stylesheet" href="http://js.arcgis.com/3.20/esri/themes/calcite/esri/esri.css">
<style>
html, body, #map {
height: 100%;
width: 100%;
margin: 0;
padding: 0;
}
</style>
</head>
<body class="calcite calcite-maps calcite-nav-top calcite-zoom-top-left calcite-layout-small-title">
<nav class="navbar calcite-navbar navbar-fixed-top calcite-text-light calcite-bg-dark">
<div class="dropdown calcite-dropdown calcite-bg-light calcite-text-dark" role="presentation">
<a class="dropdown-toggle" role="button" aria-haspopup="true" aria-expanded="false">
<div class="calcite-dropdown-toggle">
<span class="sr-only"></span>
<span></span>
<span></span>
<span></span>
<span></span>
</div>
</a>
</div>
</nav>
<div class="calcite-map">
<div id="mapViewDiv" class="calcite-map-absolute"></div>
</div>
<div class="calcite-panels calcite-panels-right calcite-bg-dark calcite-text-light panel-group" role="tablist" aria-multiselectable="true">
<div id="panelPopup" class="panel collapse">
<div id="headingPopup" class="panel-heading" role="tab">
<div class="panel-title">
<a class="panel-toggle" role="button" href="#collapsePopup" aria-expanded="true" aria-controls="collapsePopup"><span class="" aria-hidden="true"></span><span class="panel-label"></span></a>
<a class="panel-close" role="button" data-toggle="collapse" data-target="#panelPopup"><span class="esri-icon esri-icon-close" aria-hidden="true"></span></a>
</div>
</div>
<div id="collapsePopup" class="panel-collapse" role="tabpanel" aria-labelledby="headingPopup">
<div class="panel-body">
<div id="chartPanel"></div>
</div>
</div>
</div>
</div>
<script type="text/javascript">
var dojoConfig = {
packages: [{
name: "bootstrap",
location: "http://esri.github.io/calcite-maps/dist/vendor/dojo-bootstrap"
}, {
name: "calcite-maps",
location: "http://esri.github.io/calcite-maps/dist/js/dojo"
}, {
name: "themes",
location: location.pathname.replace(/\/[^/]+$/, '') + "/themes"
}]
};
</script>
<script src="http://js.arcgis.com/3.20/"></script>
<script>
require([
"esri/layers/FeatureLayer",
"esri/InfoTemplate",
"dijit/layout/TabContainer",
"dijit/layout/ContentPane",
"dojox/charting/Chart2D",
"dojox/charting/Theme",
"dojo/dom-construct",
"dojo/dom-class",
"esri/arcgis/utils",
"dojo/query",
"dojo/on",
"dijit/registry",
"dojo/dom",
"calcite-maps/calcitemaps-v0.3",
"themes/MyTheme",
"bootstrap/Collapse",
"bootstrap/Dropdown",
"bootstrap/Tab",
"dojo/domReady!"
],
function(FeatureLayer, InfoTemplate, TabContainer, ContentPane, Chart2D, Theme, domConstruct, domClass, arcgisUtils,
query, on, registry, dom, CalciteMaps, MyTheme) {
arcgisUtils.createMap("a7892820987c499ea376fe558b54eab3", "mapViewDiv", {usePopupManager: true}).then(function(response) {
window.map = response.map;
map.infoWindow.set("popupWindow", false);
initializeSidebar(window.map);
var template = new InfoTemplate();
template.setContent(getWindowContent);
var statesLayer = new FeatureLayer("http://services3.arcgis.com/oO7KYsE1NxneFsw3/arcgis/rest/services/polygon/FeatureServer/0", {
infoTemplate: template,
outFields: ["*"]
});
map.addLayer(statesLayer);
function getWindowContent(graphic) {
var tc = new TabContainer({},
domConstruct.create("div")
);
var cp1 = new ContentPane;
tc.addChild(cp1);
var hea1_ha = graphic.attributes.L1__ha_;
var hea2_ha = graphic.attributes.L2__ha_;
var hea3_ha = graphic.attributes.L3__ha_;
var c1 = domConstruct.create("div", domConstruct.create("div"));
var chart1 = new Chart2D(c1);
domClass.add(chart1, "chart");
// ------- Apply a color theme to the chart ------------------------------ //
chart1.setTheme(MyTheme);
// ---------------------------------------------------------------------- //
chart1.addPlot("default", {
type: "Pie",
});
chart1.addSeries("", [hea1_ha, hea2_ha, hea3_ha]);
cp1.set("content", chart1.node);
setTimeout(function(){
chart1.resize(220,220)
});
return tc.domNode
}
}
);
function initializeSidebar(map) {
var lp = new ContentPane({style:"height:235px"}, dom.byId("chartPanel"));
lp.startup();
var popup = window.map.infoWindow;
on(popup, "set-features", function(evt) {
if(popup.getSelectedFeature()){
if(!domClass.contains(query("#panelPopup")[0],"in")){
query("#panelPopup").collapse("toggle");
}
displayPopupContent(popup.getSelectedFeature())
}
});
}
function displayPopupContent(feature) {
if (feature) {
var content = feature.getContent();
registry.byId("chartPanel").set("content", content);
}
}
}
)
</script>
</body>
</html>
- Mark as New
- Bookmark
- Subscribe
- Mute
- Subscribe to RSS Feed
- Permalink
- Report Inappropriate Content
Thank you for your time, now I understand
But it still doesn't work when loading on a web server, it only loads on localhost:
Michelle
- Mark as New
- Bookmark
- Subscribe
- Mute
- Subscribe to RSS Feed
- Permalink
- Report Inappropriate Content
Michelle,
The answer is right in your browsers web console:

Your path to the theme is incorrect.
- Mark as New
- Bookmark
- Subscribe
- Mute
- Subscribe to RSS Feed
- Permalink
- Report Inappropriate Content
Robert, I got it working 