- Home
- :
- All Communities
- :
- User Groups
- :
- Elevation Data
- :
- Questions
- :
- Using Image Analysis Functions to Display Layer Ti...
- Subscribe to RSS Feed
- Mark Topic as New
- Mark Topic as Read
- Float this Topic for Current User
- Bookmark
- Subscribe
- Mute
- Printer Friendly Page
Using Image Analysis Functions to Display Layer Tints on Hillshades
- Mark as New
- Bookmark
- Subscribe
- Mute
- Subscribe to RSS Feed
- Permalink
- Report Inappropriate Content
Hello to everyone, i'm trying to apply this method Using Image Analysis Functions to Display Layer Tints on Hillshades | ArcWatch
to create an image that retains the original colors and details Using Image Analysis Functions to Display Layer Tints on Hillshades avoid a washed-out image with less detail. ( When the hypsometric tint is displayed transparently over the hillshade, the result is a washed-out version of the hypsometric tint and a less detailed version of the hillshade).
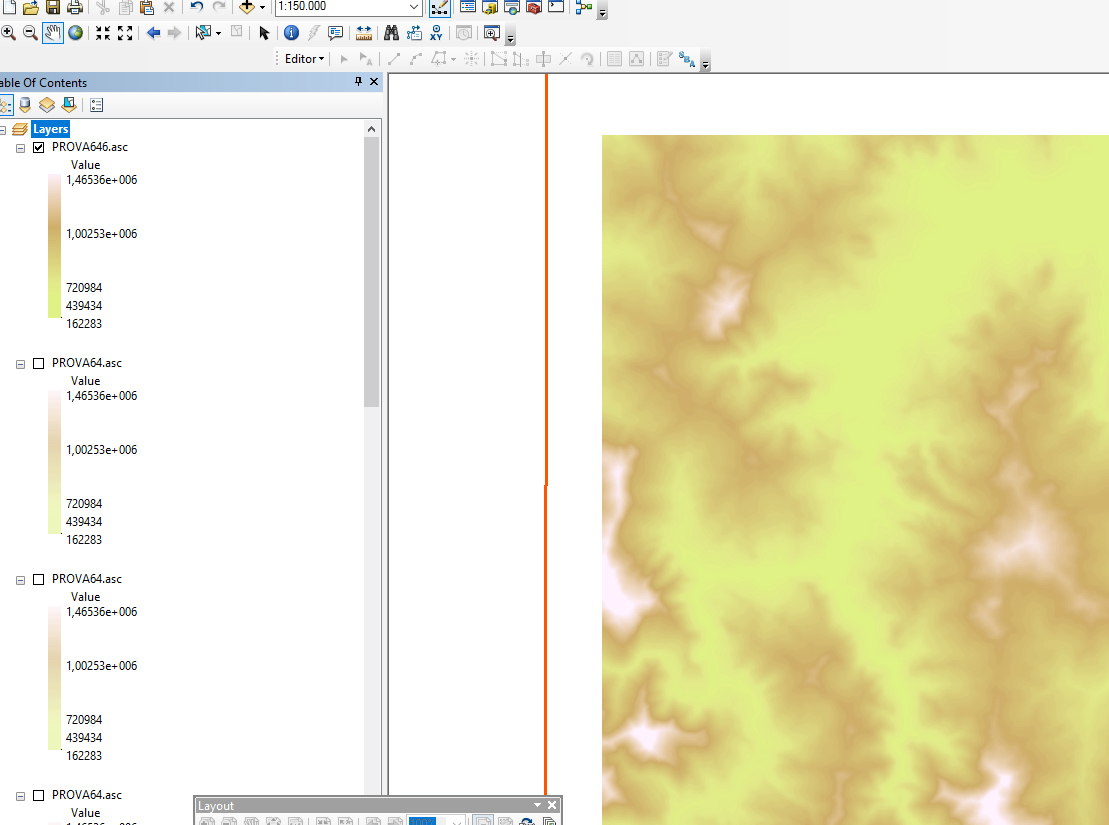
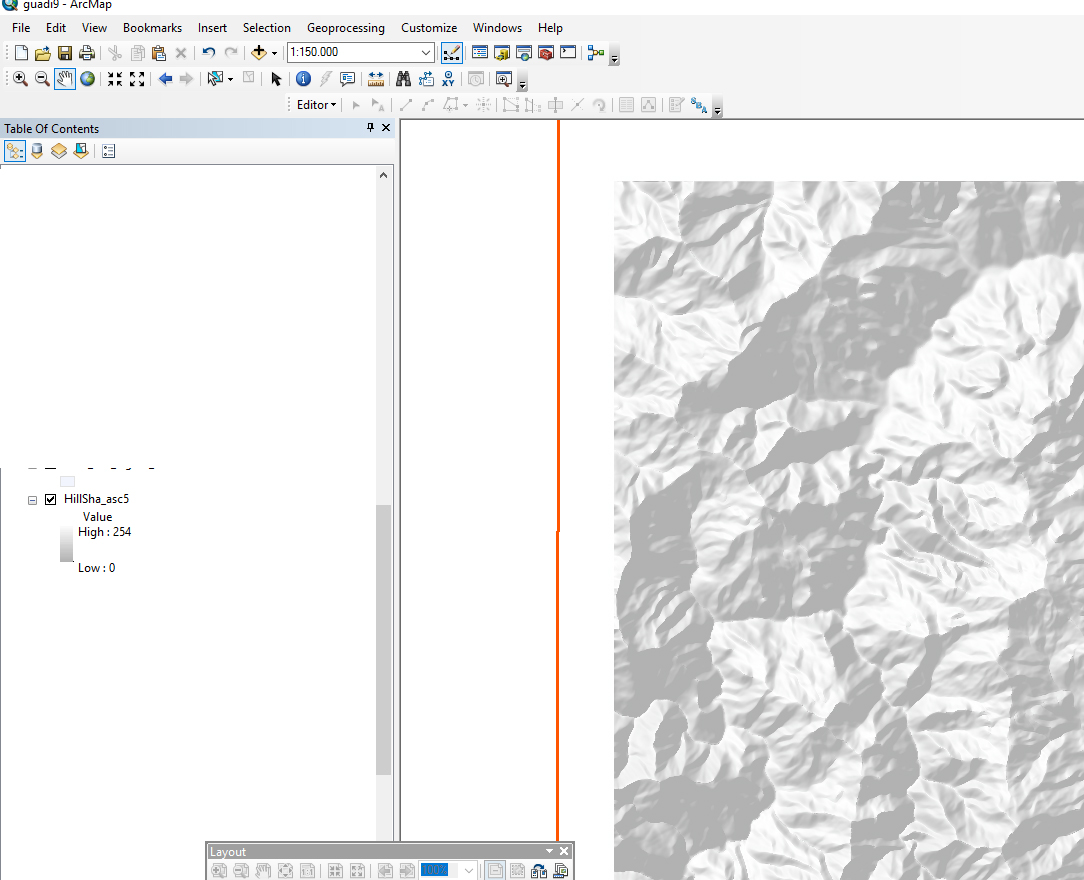
I have the layer with the applied ramp color, as in Figure 1 attached and the file in gray scale (fig2).
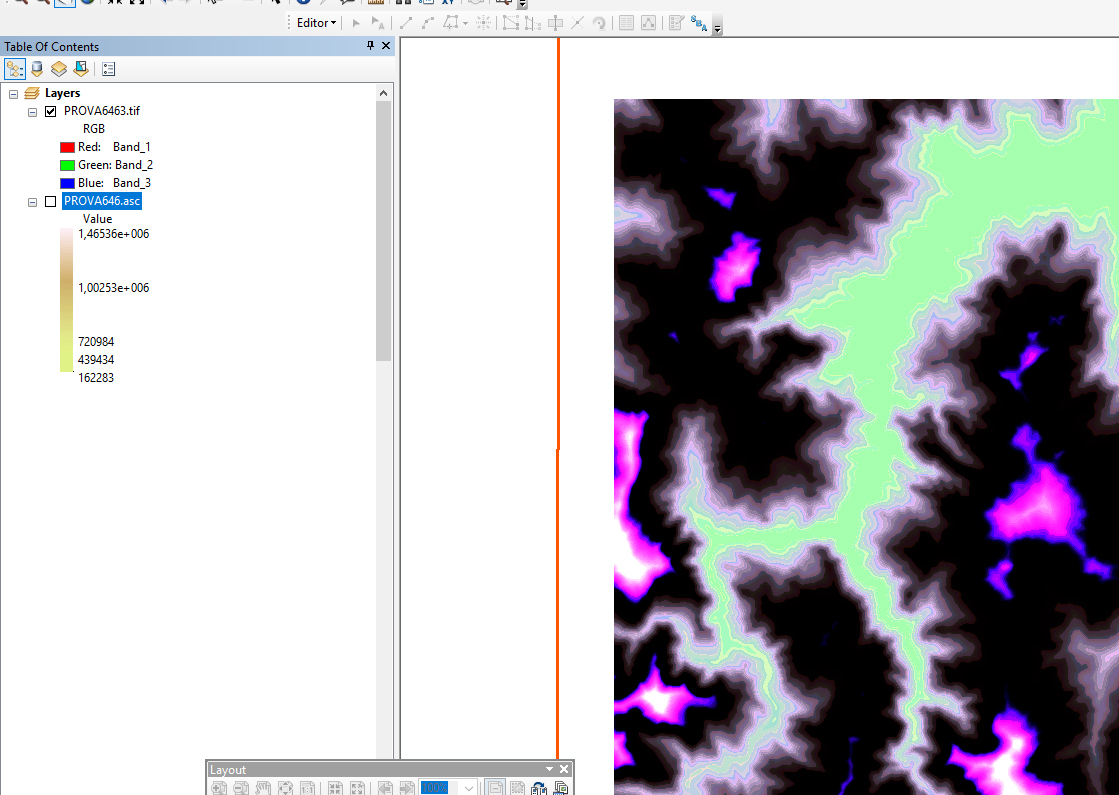
At step one,To treat the layer-tinted DEM I follow step by step instructions as follows:In the Export Raster Data dialog box, check Use Renderer and check Force RGB. Choose a location and file name, then click Save Choose to add the exported data to the map as a layer. The three-band RGB image will be added to the table of contents.
But the result is somewhat bizarre (fig3). Can you tell me why?
figure 1:

figure2:

figure3:

- Mark as New
- Bookmark
- Subscribe
- Mute
- Subscribe to RSS Feed
- Permalink
- Report Inappropriate Content
When I try to open the link to the image I get a message about an unsafe site. In GeoNet you can attach images or even better, simply copy the content of an image in the thread. Please avoid using external sites.
I normally use mosaic datasets for my DEM/DSM data and apply raster chain functions for easy visualization. See example here: https://community.esri.com/people/xander_bakker/blog/2016/07/18/using-mosaic-datasets-and-raster-cha...
It provides very fast display and visualize different derived products on the fly
- Mark as New
- Bookmark
- Subscribe
- Mute
- Subscribe to RSS Feed
- Permalink
- Report Inappropriate Content
- Mark as New
- Bookmark
- Subscribe
- Mute
- Subscribe to RSS Feed
- Permalink
- Report Inappropriate Content
thank you very much, I will also test your method, while attaching the images you could not see.
edit:
I created a mosaic dataset in my database and then I added the two raster layers to this mosaic dataset.
Now what should I do to visualize them? Processing template tab is empty e and mosaic dataset layer is displayed on screen as White.Thanks for your patience!
- Mark as New
- Bookmark
- Subscribe
- Mute
- Subscribe to RSS Feed
- Permalink
- Report Inappropriate Content
In my blog post: https://community.esri.com/people/xander_bakker/blog/2016/07/18/using-mosaic-datasets-and-raster-cha... there are a number of tools you should use:
- Create Mosaic Dataset
- Add Rasters To Mosaic Dataset
- Build Overviews
After that the mosaic dataset should display normally. To implement the Raster Chain functions I recommend you to use the step described in Editing function chains in a mosaic dataset—Help | ArcGIS Desktop
The Raster Chain function that combines the hill shade and a color ramp is: Shaded Relief function—Help | ArcGIS Desktop