- Home
- :
- All Communities
- :
- Products
- :
- ArcGIS GeoPlanner
- :
- ArcGIS GeoPlanner Questions
- :
- What's New in GeoPlanner (June 2017)
- Subscribe to RSS Feed
- Mark Topic as New
- Mark Topic as Read
- Float this Topic for Current User
- Bookmark
- Subscribe
- Mute
- Printer Friendly Page
What's New in GeoPlanner (June 2017)
- Mark as New
- Bookmark
- Subscribe
- Mute
- Subscribe to RSS Feed
- Permalink
- Report Inappropriate Content
Our next update to GeoPlanner for ArcGIS will occur in conjunction with ArcGIS Online at the end of June 2017. This is going to be a great update with lots of goodies to help you plan, design and test scenarios. We’ve worked hard over the past few months to help you better understand and analyze your scenarios and other assets in your GeoPlanner projects. This includes support for selection sets, new reports, planning study areas, and a dockable dashboard. One big announcement – We’ve made our suitability modeling tool (that thing that does fast web-based weighted overlay) part of the Web AppBuilder. You can now create, discover and use models in either environment!
Select scenario features
You can now select multiple scenario features in GeoPlanner. To help you be more productive in scenario design, you can cut, copy, paste and delete selected scenario features. The dashboard can also report on selected features so you can more precisely understand and assess scenario impact.

Work within planning study areas
To help you define areas in which planning activities take place, you can now configure study areas. Study areas are areas in which you can design scenarios and report on key performance indicators in the dashboard and reports. You define study areas by sketching polygons into a new study area layer. When a study area is activated, GeoPlanner reports on scenarios that intersect the active study area and masks the area outside the activated study area. You can import features that are within a study areas into a scenario.
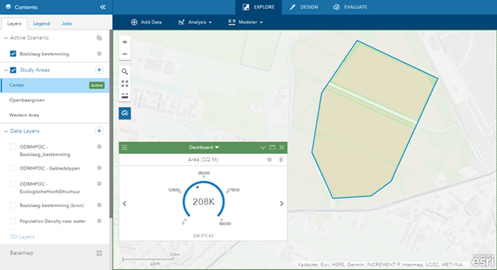
Study areas help you evaluate your plans and designs. Use study areas to easily toggle between different planning subareas. You can see how your dashboard changes as you move between different areas.
New types of reports
This update to GeoPlanner includes two new types of reports, a baseline natural assets report and a chart report.
The baseline report, at this update, creates a PDF or XLSX of USA Landscape layers within a US State, County or Hydrologic Unit (HUC). Supported HUC levels include 2, 4, 6, 8, and 10. The report works against curated layers within Esri’s Living Atlas so you can use authoritative datasets to generate information products for comprehensive, open space or other types of planning elements. You can also use this report for environmental screening reports. Future releases of this report will include the ability to use custom geographies and generate reports outside the USA.
The chart report is useful for environmental screening workflows and helps you evaluate potential impacts of your scenarios on an area. Use this report to understand how a development initiative, a conservation plan, or any other project impacts an area. If your charts reference a suitability model, the report will show how your scenario features summarize your models. You can include models created by GeoPlanner’s modeler utility or those created using the classification tool. Reports are currently available in CSV format.
You can use a study area to define a geography for GeoPlanner reports.
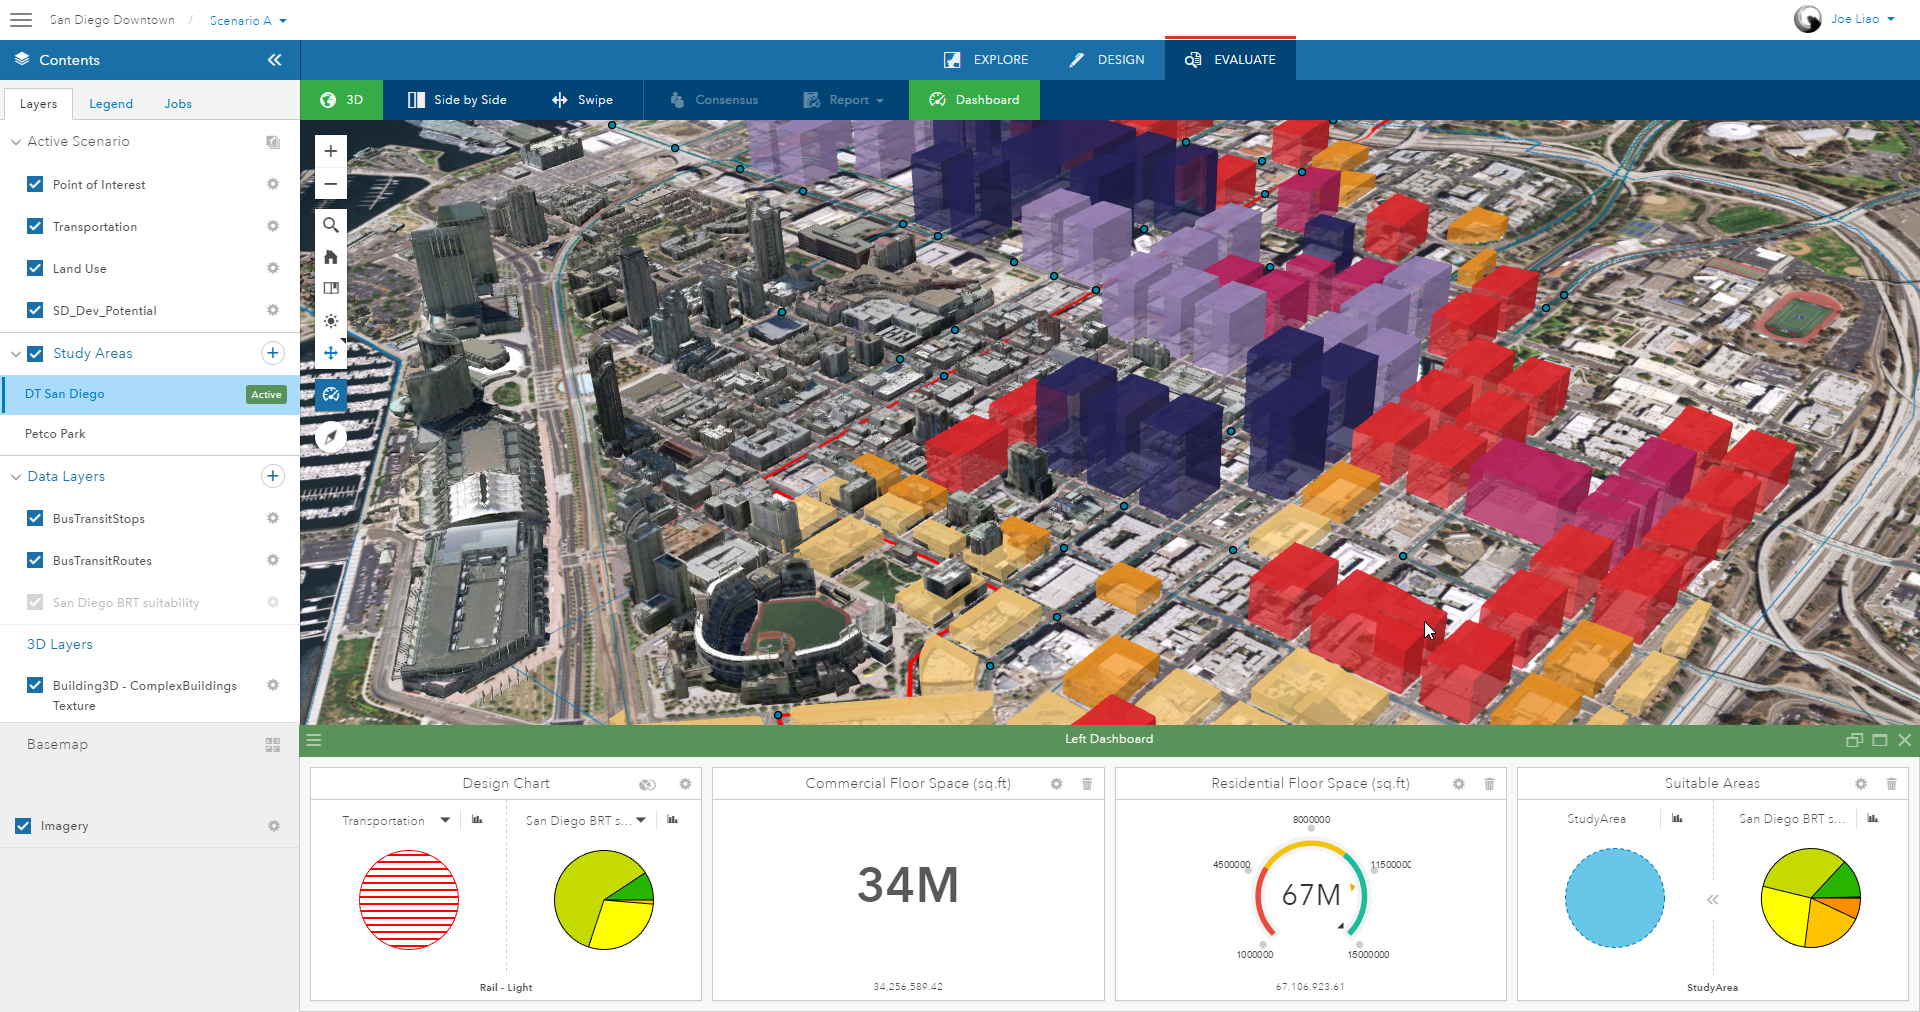
Dockable dashboard
GeoPlanner dashboards can be moved, maximized, minimized and now docked to the bottom of the application. This will help you see more Key Performance Indicators (KPIs) as you work. You can also scroll through your docked dashboard.
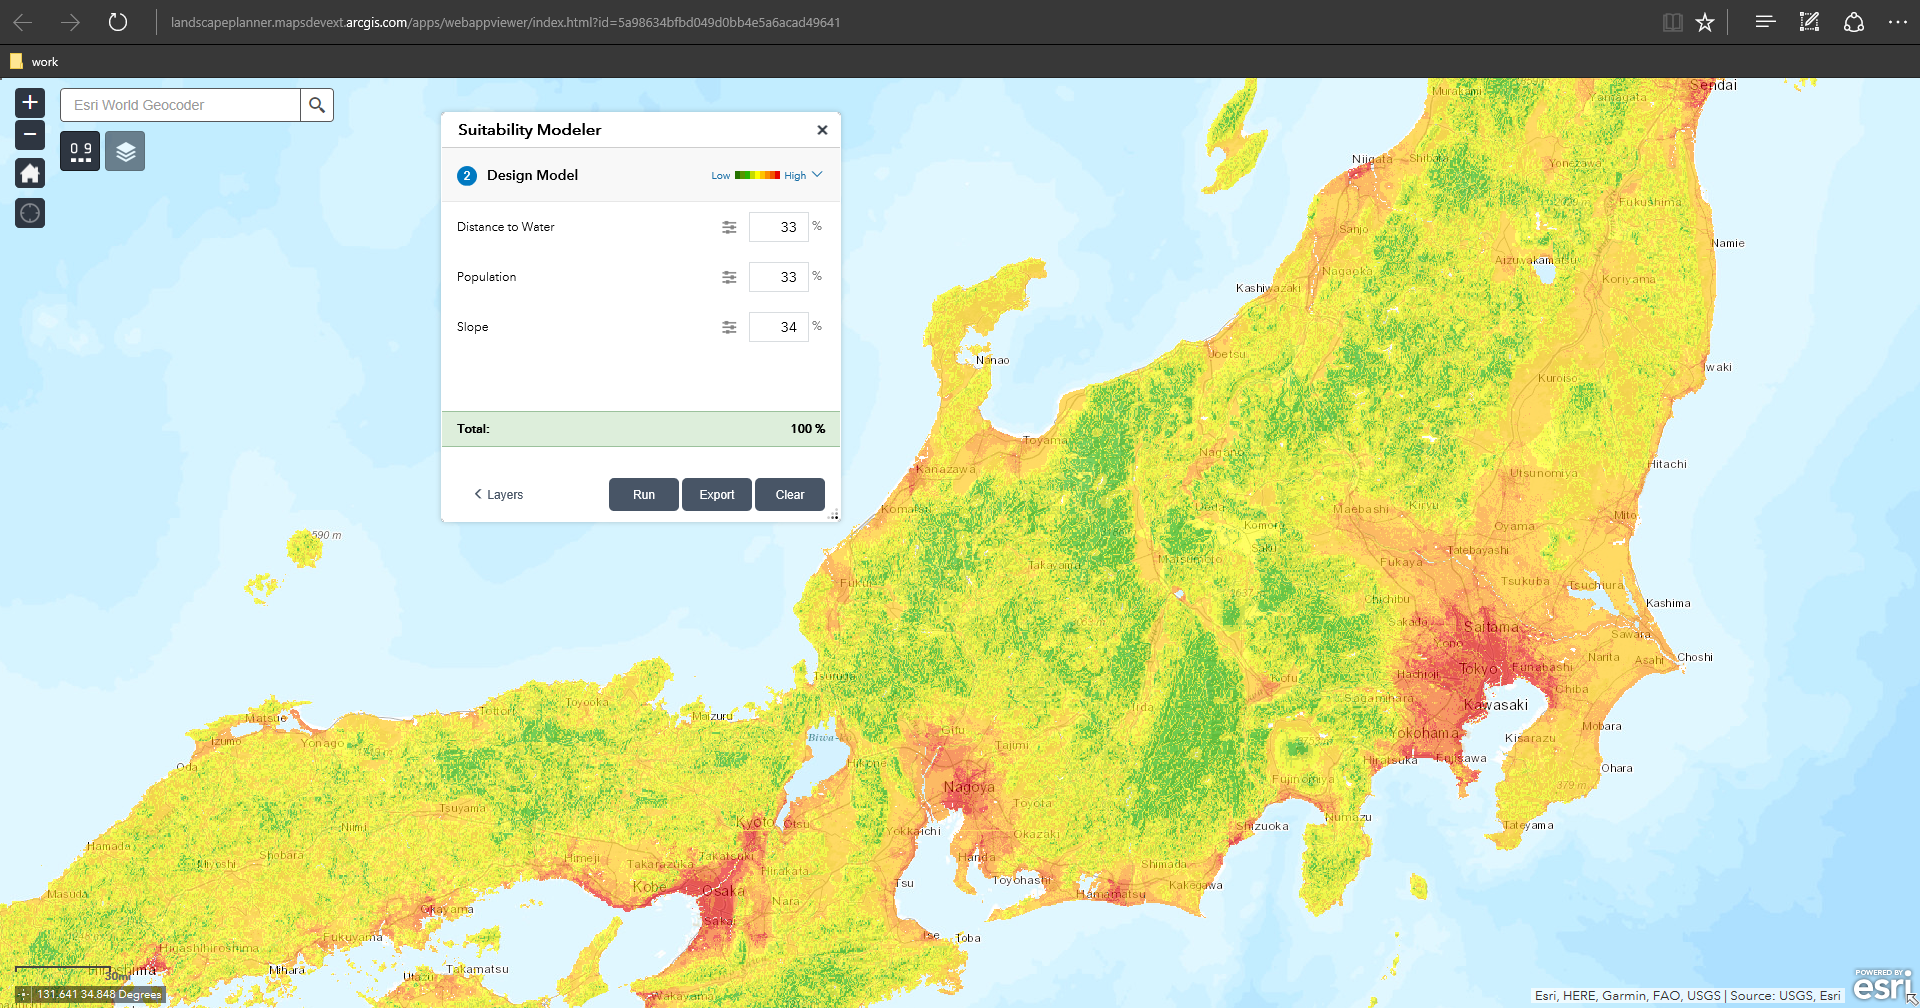
Suitability modeler now part of Web AppBuilder
GeoPlanner’s modeler utility helps you perform suitability modeling so you can identify risks and opportunities in an area. This utility is now a widget in the Web AppBuilder. You can use this widget with three Esri-curated suitability modeling services in the Living Atlas or with services that you build and host in your own infrastructure. This widget allows you to create new models from services or from an existing model. Models created by this widget can also be used in GeoPlanner. Use this widget to enable others to discover, use and share suitability models in your custom web apps built with Web AppBuilder.
Don’t have GeoPlanner? Don’t worry! You can try it for free. Follow these instructions on how to access a free trial. Click on the Don’t have an ArcGIS Online subscription link.