Turn on suggestions
Auto-suggest helps you quickly narrow down your search results by suggesting possible matches as you type.
Cancel
- Home
- :
- All Communities
- :
- Products
- :
- ArcGIS Enterprise
- :
- ArcGIS Enterprise Portal Questions
- :
- Vector field (velocity field)
Options
- Subscribe to RSS Feed
- Mark Topic as New
- Mark Topic as Read
- Float this Topic for Current User
- Bookmark
- Subscribe
- Mute
- Printer Friendly Page
Vector field (velocity field)
Subscribe
4791
3
08-25-2011 05:16 AM
08-25-2011
05:16 AM
- Mark as New
- Bookmark
- Subscribe
- Mute
- Subscribe to RSS Feed
- Permalink
- Report Inappropriate Content
Hi everyone.
I made a 2-D hydrodynamic model in another software (Matlab). The resulting output is a velocity field. I have exported results in an ASCII file containing 4 columns: x,y,u,v which correspond respectively to longitude, latitude, east component, north component.
I would like to know if it was possible in ArcGIS to plot a vector filed from my results.
Thank in advance,
Phil
3 Replies
09-17-2011
01:34 AM
- Mark as New
- Bookmark
- Subscribe
- Mute
- Subscribe to RSS Feed
- Permalink
- Report Inappropriate Content
Hi Phil,
Don't know if you already solved this interesting problem?
I believe you will need to first convert U and V to Angle (A) and Length (L) of vectors. I suggest you copy your data to an Excel spreadsheet and do the calculations there. If you place U in column D and V in column E, you may then use the following formulas to calculate A and L:
A = ARCTAN(E2/D2)*180/PI()
L = KVROD(D2^2+E2^2)
Import the table data to ArcGIS. Convert to shapefile or featureclass.
You may now set the point symbology using Categories, Select Unique values/ many fields, Specify value fields A and L. Right click a symbol and select properties for all symbols. Find an arrow that points towards the right (you can in fact use and arrow, and change the direction of it to make it point right).
In the Advanced symbol settings, set the Rotation angle to base on field A - artihmetic. And set the size of the points (arrows) to base on field L.
Hope this helps,
Eva
09-21-2011
01:28 AM
- Mark as New
- Bookmark
- Subscribe
- Mute
- Subscribe to RSS Feed
- Permalink
- Report Inappropriate Content
Dear Eva,
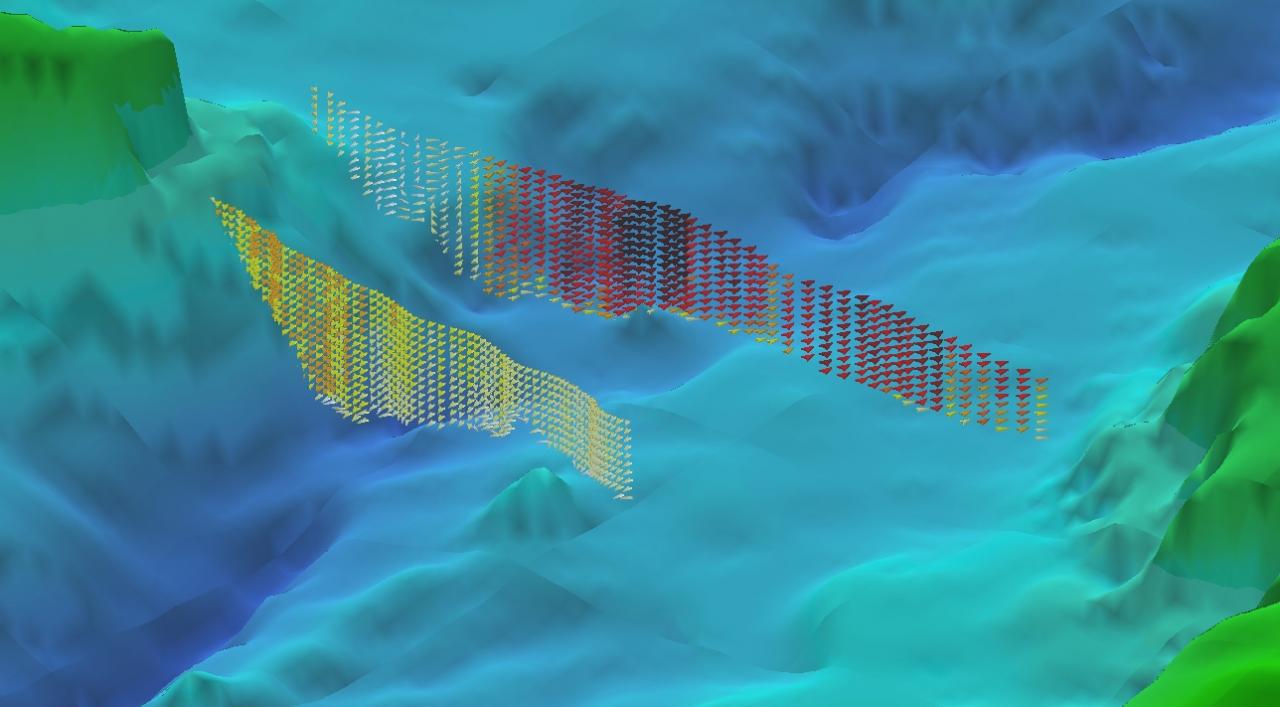
Your response to Phil seems very interesting. I have a similar problem in that I have 3D velocity data from an Acoustic Doppler Current Profiler (ADCP) survey that we recently carried out. I have managed to display the vectors in the horizontal plane about 360 degrees (please see attached) but would like to display the data in 3D, i.e. flow in all other directions (up, down, diagonal, as well as horizontal). I have created text files for each of the velocity components (east, north, up/down) as well as the corresponding depths and latitude and longitude for each vector through the water column.
I was just wondering whether you know a way of displaying this data in 3D in ArcScene?
Kind regards,
Paul
11-12-2013
04:20 AM
- Mark as New
- Bookmark
- Subscribe
- Mute
- Subscribe to RSS Feed
- Permalink
- Report Inappropriate Content
Dear all I have a current velocity filed u and v, and would like to calculate the velocity and Angel in a way that I can present it using geographical North =O.
In the ArcMap I get the correct velocity filed using the following ecuation in rotation experession:
(180/pi)*atan2(v,u)+90, using aritmetic presentation.
However I would like to have the data, because I need them for the traking analysis which requires angle and length (velocity) raster as input. I didnt find a way to save the data rotated according to the formulae above.
Smebody know how to do that.