- Home
- :
- All Communities
- :
- Products
- :
- ArcGIS CityEngine
- :
- ArcGIS CityEngine Questions
- :
- Use CityEngine with traffic data
- Subscribe to RSS Feed
- Mark Topic as New
- Mark Topic as Read
- Float this Topic for Current User
- Bookmark
- Subscribe
- Mute
- Printer Friendly Page
Use CityEngine with traffic data
- Mark as New
- Bookmark
- Subscribe
- Mute
- Subscribe to RSS Feed
- Permalink
- Report Inappropriate Content
Hi all,
I created a city model of my town, Cosenza with a collegue who already posted questions about cityengine. I would like to import data traffic in ce to represent how the pollution involves the buildings and the surrounding environment. I would like to know how to use the potential of ce to create 3d images showing this kind of problems. I attached an image that shows how I would like to represent the pollution and noise to the buildings coused by the traffic.
I will appreciate any idea/suggestion.
Thank you
- Mark as New
- Bookmark
- Subscribe
- Mute
- Subscribe to RSS Feed
- Permalink
- Report Inappropriate Content
Hi Giuseppe,
There are two main approaches I could suggested.
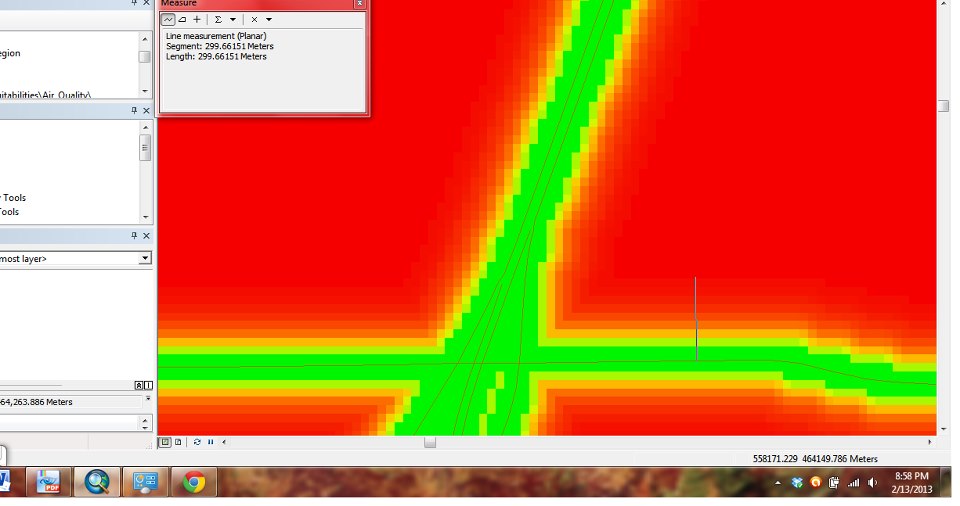
Raster Based: One option is to drape a raster showing pollution intensity based on the distance from/intensity of traffic. I have for example used regression formulas in various papers tied with a euclidean distance to create particulate pollution dissipation bands in the image below (falling to zero at about 300 m). It might be possible to tie this with 3D Analyst and have this approach create draped rasters over your exported multipatches from CityEngine.
Vector Based: Another option is to summarize pollution/traffic exposure by building on the building level. Once you do a few spatial joins you can use that information on the lot level to color buildings on a relative scale of pollution exposure. In the image you displayed, you could buildings with high exposure have more red than white as it ascends up the floors. I have used similar approaches to simulate flooding as part of a sea level rise rule, but instead I color the flood level blue, but the rest of the building based on the percentage of floors exposed.
I hope this is helpful.
David