- Home
- :
- All Communities
- :
- Products
- :
- ArcGIS Dashboards
- :
- ArcGIS Dashboards Ideas
- :
- Bar charts based on attribute values grouped by co...
- Subscribe to RSS Feed
- Mark as New
- Mark as Read
- Bookmark
- Follow this Idea
- Printer Friendly Page
- Report Inappropriate Content
Bar charts based on attribute values grouped by configurable field in Operations Dashboard
- Mark as New
- Bookmark
- Subscribe
- Mute
- Subscribe to RSS Feed
- Permalink
- Report Inappropriate Content
I was surprised that I could not create a bar chart that would sum the value of the field grouping by the value of another field. While it was easy to configure a bar chart that would display counts of features grouped by sum value, I could not create a bar chart that displayed a statistical calculation of one field grouped by another.
Use case example: I have a feature class of building footprints. Each footprint has an attribute storing total gross sqft and and attribute storing a classification value for the building. I wanted to create a bar chart that displayed the total gross sqft per building classification from a feature layer data source. While I could (and did eventually) create a table layer in my service that calculated total gross sqft per classifiction, the disadvantage to this approach was that the bar chart widget could not update dynamically in response to filters applied to the feature class layer.
- Mark as Read
- Mark as New
- Bookmark
- Permalink
- Report Inappropriate Content
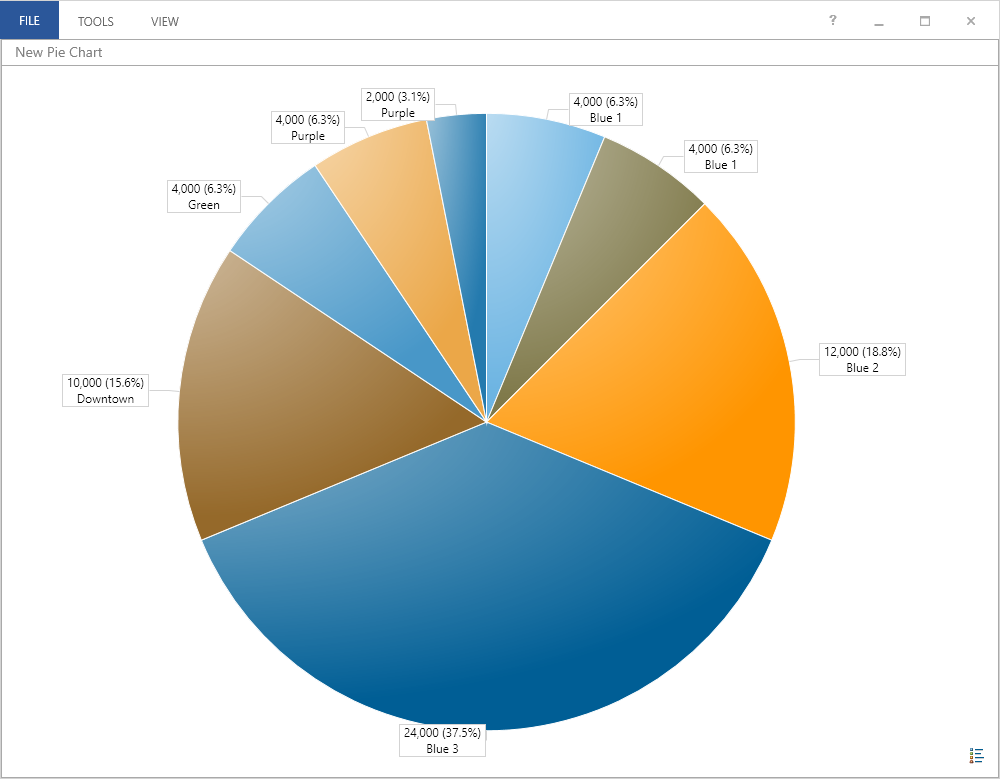
We need this for any chart available with Operations Dashboard. I have a table within a feature class that contains records of flushing dead end water lines in separate pressure zones. As the OP mentioned, the only viable way to group the pressure zones and the sums of water flushed is to create a new table.
Operations Dashboard pie chart sample:
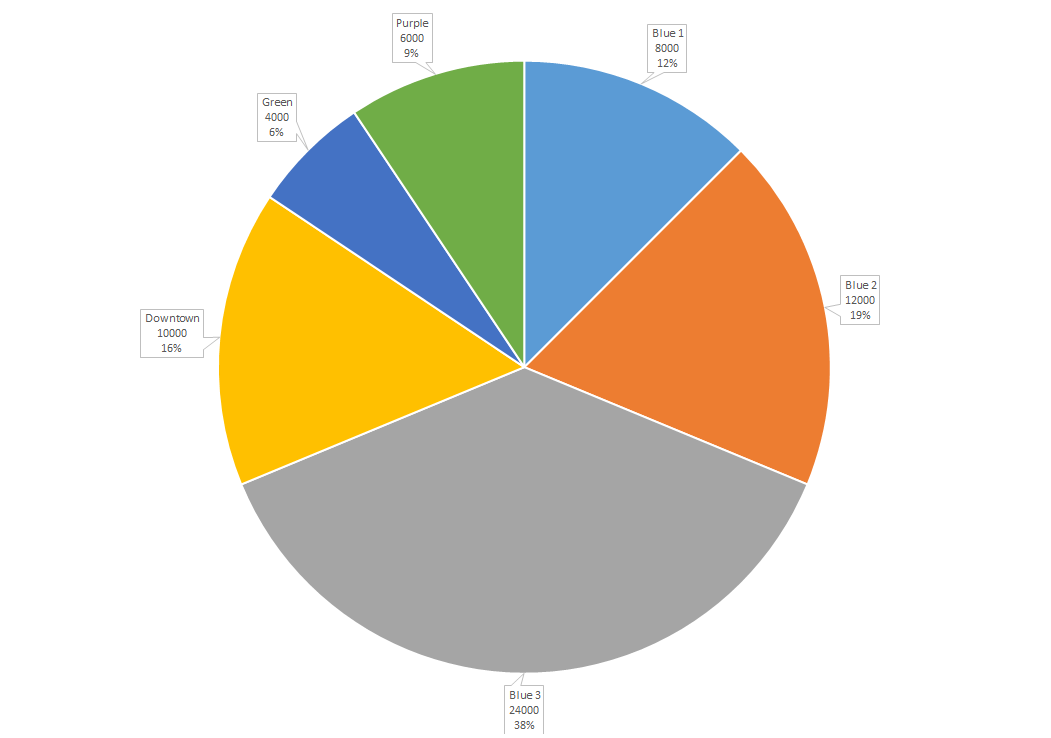
What it should look like:
- Mark as Read
- Mark as New
- Bookmark
- Permalink
- Report Inappropriate Content
Jade/Forrest,
Please take a look at the serial chart options with the upcoming release of the new Web-centric Dashboard to see if it satisfies your requirements.
I was able to replicate your use case Jade:
1. Choose the serial chart element.
2. Within the Data tab choose Grouped Values
3. Pick your building classification field as the category field (yes this can come from a coded value domain).
4. For the Statistic choose Sum.
5. For the Field to calculate the statistic from, choose your sq footage field.
Please let us know if this does not satisfy your requirements.
Thanks,
Jeff
- Mark as Read
- Mark as New
- Bookmark
- Permalink
- Report Inappropriate Content
The product has evolved quite a bit since this idea was submitted. As per comment from @JeffShaner, the functionality requested is already supported.
You must be a registered user to add a comment. If you've already registered, sign in. Otherwise, register and sign in.