- Home
- :
- All Communities
- :
- Developers
- :
- JavaScript Maps SDK
- :
- JavaScript Maps SDK Questions
- :
- custom map tool javasctipt
- Subscribe to RSS Feed
- Mark Topic as New
- Mark Topic as Read
- Float this Topic for Current User
- Bookmark
- Subscribe
- Mute
- Printer Friendly Page
- Mark as New
- Bookmark
- Subscribe
- Mute
- Subscribe to RSS Feed
- Permalink
- Report Inappropriate Content
Hi, I am new to ArcGIS JavaScript API, I would like to create custom tool on my web app, I search internet, it seems all I can find is custom widget, for example I want to develop custom tool when click the map just display the x, y values in a custom dialog showing where the mouse clicked, and query the feature layer. how can I get started? The following is the sample I took from esri website and I want to add my custom tool to the group, but it does not work. I don't know what I did wrong here, Can anyone help? Thank you in advance.
Dave
<!DOCTYPE html>
<html>
<head>
<meta http-equiv="Content-Type" content="text/html; charset=utf-8">
<meta name="viewport" content="initial-scale=1, maximum-scale=1,user-scalable=no">
<title>Shapes and Symbols</title>
<link rel="stylesheet" href="https://js.arcgis.com/3.16/esri/css/esri.css">
<style>
#info {
top: 20px;color: #444;height: auto; font-family: arial;right: 20px; margin: 5px;
padding: 10px; position: absolute; width: 115px; z-index: 40; border: solid 2px #666;
border-radius: 4px; background-color: #fff;
}
html, body, #mapDiv { padding:0; margin:0; height:100%; }
button { display: block; }
</style>
<script src="https://js.arcgis.com/3.16/"></script>
<script>
var map, tb;
require([
"esri/map", "esri/toolbars/draw",
"esri/symbols/SimpleMarkerSymbol", "esri/symbols/SimpleLineSymbol",
"esri/symbols/PictureFillSymbol", "esri/symbols/CartographicLineSymbol",
"esri/graphic", "esri/Color", "dojo/dom", "dojo/on", "dojo/domReady!"
], function(
Map, _Draw,
SimpleMarkerSymbol, SimpleLineSymbol, PictureFillSymbol, CartographicLineSymbol,
_Graphic, Color, dom, on
) {
map = new Map("mapDiv", {
basemap: "streets",
center: [-25.312, 34.307],
zoom: 3
});
map.on("load", initToolbar);
// markerSymbol is used for point and multipoint, see http://raphaeljs.com/icons/#talkq for more examples
var markerSymbol = new SimpleMarkerSymbol();
markerSymbol.setPath("M16,4.938c-7.732,0-14,4.701-14,10.5c0,1.981,0.741,3.833,2.016,5.414L2,25.272l5.613-1.44c2.339,1.316,5.237,2.106,8.387,2.106c7.732,0,14-4.701,14-10.5S23.732,4.938,16,4.938zM16.868,21.375h-1.969v-1.889h1.969V21.375zM16.772,18.094h-1.777l-0.176-8.083h2.113L16.772,18.094z");
markerSymbol.setColor(new Color("#00FFFF"));
// lineSymbol used for freehand polyline, polyline and line.
var lineSymbol = new CartographicLineSymbol(
CartographicLineSymbol.STYLE_SOLID,
new Color([255,0,0]), 10,
CartographicLineSymbol.CAP_ROUND,
CartographicLineSymbol.JOIN_MITER, 5
);
// fill symbol used for extent, polygon and freehand polygon, use a picture fill symbol
// the images folder contains additional fill images, other options: sand.png, swamp.png or stiple.png
var fillSymbol = new PictureFillSymbol("images/mangrove.png",
new SimpleLineSymbol(SimpleLineSymbol.STYLE_SOLID,new Color('#000'),1), 42, 42);
function initToolbar() {
tb = new _Draw(map);
tb.on("draw-end", addGraphic);
// event delegation so a click handler is not
// needed for each individual button
on(dom.byId("info"), "click", function(evt) {
//alert(evt.target.id); //show up
if ( evt.target.id === "info" ) {
return;
}
var tool = evt.target.id.toLowerCase();
map.disableMapNavigation();
if(tool != "mycustomtool")
tb.activate(tool);
else
{
map.disableMapNavigation();
on(map, "click", function Map_Click() { alert("custom tool"); } ) //this will never show up
}
});
}
function addGraphic(evt) {
//deactivate the toolbar and clear existing graphics
tb.deactivate();
map.enableMapNavigation();
// figure out which symbol to use
var symbol;
if ( evt.geometry.type === "point" || evt.geometry.type === "multipoint") {
symbol = markerSymbol;
} else if ( evt.geometry.type === "line" || evt.geometry.type === "polyline") {
symbol = lineSymbol;
}
else {
symbol = fillSymbol;
}
map.graphics.add(new _Graphic(evt.geometry, symbol));
}
});
</script>
</head>
<body>
<div id="info">
<div>Select a shape then draw on map to add graphic</div>
<button id="Point">Point</button>
<button id="Multipoint">Multipoint</button>
<button id="Line">Line</button>
<button id="Polyline">Polyline</button>
<button id="FreehandPolyline">Freehand Polyline</button>
<button id="Triangle">Triangle</button>
<button id="Extent">Rectangle</button>
<button id="Circle">Circle</button>
<button id="Ellipse">Ellipse</button>
<button id="Polygon">Polygon</button>
<button id="FreehandPolygon">Freehand Polygon</button>
<button id="MyCustomeTool">Custom tool</button>
</div>
<div id="mapDiv"></div>
</body>
</html>
Solved! Go to Solution.
Accepted Solutions
- Mark as New
- Bookmark
- Subscribe
- Mute
- Subscribe to RSS Feed
- Permalink
- Report Inappropriate Content
Hi Dave glad to hear that helped.
Please mark the conversation as answered for future searches.
- Mark as New
- Bookmark
- Subscribe
- Mute
- Subscribe to RSS Feed
- Permalink
- Report Inappropriate Content
Add a listener in order to detect the mouse events (move , click e.t.c)
| dojo.connect(map, "onMouseMove", onMapMouseMove); | //for XY coordinates |
then onMapMouseMove function take the x, y from the event , convert it to the coordinate you want to show and add this on a div on your interface. below is a sample:
function onMapMouseMove(event){
if (map.spatialReference.isWebMercator()){
var GeoPOint = esri.geometry.webMercatorToGeographic(event.mapPoint);
}else{
var GeoPOint = event.mapPoint;
}
var x = GeoPOint.x.toFixed(5);
var y = GeoPOint.y.toFixed(5);
dojo.byId('mapPosition').innerHTML = dojo.string.substitute('<b>λ:</b> '+'${0}, <b>φ:</b> ${1}', [x, y]);
}
- Mark as New
- Bookmark
- Subscribe
- Mute
- Subscribe to RSS Feed
- Permalink
- Report Inappropriate Content
Hi, Panagiotis, Great thanks for your response, I will try out.
- Mark as New
- Bookmark
- Subscribe
- Mute
- Subscribe to RSS Feed
- Permalink
- Report Inappropriate Content
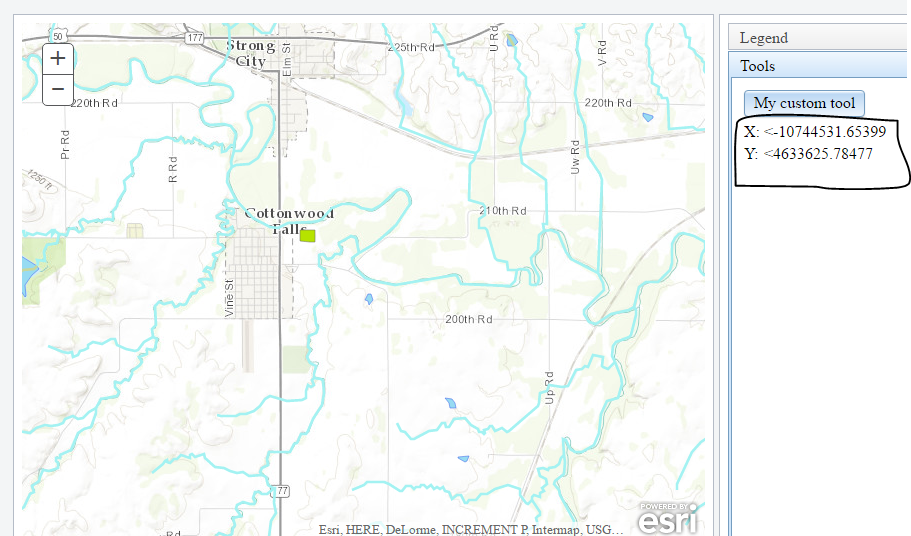
Thank you for your advice, Panagiotis, my current version legend and dummy custom tool somewhat working, but I got two errors, like the following:
first error is keep getting following error in first line (<!DOCTYPE html>):
XMLHttpRequest cannot load http://sampleserver3.arcgisonline.com/ArcGIS/rest/info?f=json. No 'Access-Control-Allow-Origin' header is present on the requested resource. Origin 'null' is therefore not allowed access.
also I try to get my dialog box pop up and display the x and y value at where use clicked. but it does not show up. Can you or anyone help me?
I am very appreciate for any sugguestions.
Dave
//the following are codes I currently have.
<!DOCTYPE html>
<html>
<head>
<meta http-equiv="Content-Type" content="text/html; charset=utf-8">
<meta name="viewport" content="initial-scale=1, maximum-scale=1,user-scalable=no">
<title>Map with legend</title>
<link rel="stylesheet" href="https://js.arcgis.com/3.16/dijit/themes/claro/claro.css">
<link rel="stylesheet" href="https://js.arcgis.com/3.16/esri/css/esri.css">
<style>
html, body {
height: 97%;
width: 98%;
margin: 1%;
}
#rightPane {
width: 20%;
}
#legendPane {
border: solid #97DCF2 1px;
}
</style>
<script src="https://js.arcgis.com/3.16/"></script>
<script>
var map, currTool;
//require(["esri/config"], function(esriConfig) { esriConfig.defaults.io.corsDetection = false; });
require(["esri/tasks/GeometryService","esri/tasks/ProjectParameters"], function(GeometryService, ProjectParameters){
var params = new ProjectParameters();
//params.geometries = [point];
//params.outSR = outSR;
//params.transformation = transformation;
//gsvc.project(params); //
});
require(["dijit/form/Button"], function(Button) { });
require(["dijit/Dialog", "dijit/form/TextBox", "dijit/form/Button"]);
require([
"esri/map", "esri/layers/FeatureLayer", "esri/dijit/Legend",
"dojo/_base/array", "dojo/parser",
"dijit/layout/BorderContainer", "dijit/layout/ContentPane",
"dijit/layout/AccordionContainer", "dojo/domReady!"
], function(
Map, FeatureLayer, Legend,
arrayUtils, parser
) {
parser.parse();
map = new Map("map", {
basemap:"topo",
center: [-96.53, 38.374],
zoom: 13
});
var rivers = new FeatureLayer("https://sampleserver3.arcgisonline.com/ArcGIS/rest/services/Hydrography/Watershed173811/MapServer/1", {
mode: FeatureLayer.MODE_ONDEMAND,
outFields:["*"]
});
var waterbodies = new FeatureLayer("https://sampleserver3.arcgisonline.com/ArcGIS/rest/services/Hydrography/Watershed173811/MapServer/0", {
mode: FeatureLayer.MODE_ONDEMAND,
outFields:["*"]
});
//add the legend
map.on("layers-add-result", function (evt) {
var layerInfo = arrayUtils.map(evt.layers, function (layer, index) {
return {layer:layer.layer, title:layer.layer.name};
});
if (layerInfo.length > 0) {
var legendDijit = new Legend({
map: map,
layerInfos: layerInfo
}, "legendDiv");
legendDijit.startup();
}
});
map.on("click", function (evt) {
handle_mapEvents(evt);
});
map.addLayers([waterbodies, rivers]);
});
/////////////////////////////
function handle_customTool()
{
//myDialog.show(); //does show up
currTool = "customTool";
}
function handle_mapEvents(evt){
if(currTool === "customTool")
{
var GeoPOint;
//if (map.spatialReference.isWebMercator())
{
GeoPOint = evt.mapPoint; //esri.geometry.webMercatorToGeographic(event.mapPoint);
var x = GeoPOint.x.toFixed(5); //Deferred long-running timer task(s) to improve scrolling smoothness. See crbug.com/574343.
var y = GeoPOint.y.toFixed(5);
alert("mouse click location is: (" + x + "," + y + ")"); //works
//alert(GeoPOint.spatialReference.latestWkid);//works
//alert(view.spatialReference.wkid)//works
//The following three line code does not working ????????????
dijit.byId("txt_X").innerHTML = "" + x;
dijit.byId("txt_Y").innerHTML = "" + y;
dijit.byId("myDialog").show(); //
}
}else
{
alert("will execute other tool action");
}
}
</script>
</head>
<body class="claro">
<!--[if IE 7]>
<style>
html, body {
margin: 0;
}
</style>
<![endif]-->
<div data-dojo-type="dijit/Dialog" data-dojo-id="myDialog" title="My Custom Tool">
<table>
<tr>
<td><LABEL for="X:">X: </LABEL></td>
<td><INPUT type="text" data-dojo-type="dijit/form/TextBox" id="txt_X"></td>
</tr>
<tr>
<td><LABEL for="Y:">Y: </LABEL></td>
<td><INPUT type="text" data-dojo-type="dijit/form/TextBox" id="txt_Y"></td>
</tr>
</table>
</div>
<div id="content"
data-dojo-type="dijit/layout/BorderContainer"
data-dojo-props="design:'headline', gutters:true"
style="width: 100%; height: 100%; margin: 0;">
<div id="rightPane"
data-dojo-type="dijit/layout/ContentPane"
data-dojo-props="region:'right'">
<div data-dojo-type="dijit/layout/AccordionContainer">
<div data-dojo-type="dijit/layout/ContentPane" id="legendPane"
data-dojo-props="title:'Legend', selected:true">
<div id="legendDiv"></div>
</div>
<div data-dojo-type="dijit/layout/ContentPane"
data-dojo-props="title:'Tools'">
<button data-dojo-type="dijit/form/Button" type="button" onClick="handle_customTool();">My custom tool</button>
</div>
</div>
</div>
<div id="map"
data-dojo-type="dijit/layout/ContentPane"
data-dojo-props="region:'center'"
style="overflow:hidden;">
</div>
</div>
</body>
</html>
- Mark as New
- Bookmark
- Subscribe
- Mute
- Subscribe to RSS Feed
- Permalink
- Report Inappropriate Content
Hi Dave
see the following Edit fiddle - JSFiddle
something happened with Dialog box. I placed the Table on below Custom tool button
- Mark as New
- Bookmark
- Subscribe
- Mute
- Subscribe to RSS Feed
- Permalink
- Report Inappropriate Content
also you can place the Y,X table inside map and allow user to see mouse coords on mouse move
- Mark as New
- Bookmark
- Subscribe
- Mute
- Subscribe to RSS Feed
- Permalink
- Report Inappropriate Content
Hi, PanagiotisPanagiotis Papadopoulos
Thank you for reply, I am trying so hard to make it pop up as a dialog box and can be drag around.
what I did wrong here?
- Mark as New
- Bookmark
- Subscribe
- Mute
- Subscribe to RSS Feed
- Permalink
- Report Inappropriate Content
- Mark as New
- Bookmark
- Subscribe
- Mute
- Subscribe to RSS Feed
- Permalink
- Report Inappropriate Content
Also try to use jQuery for User Interface
- Mark as New
- Bookmark
- Subscribe
- Mute
- Subscribe to RSS Feed
- Permalink
- Report Inappropriate Content
Hi, Panagiotis
Thank you for your reply, this help me a lot on my project. I really appreciate your help.
Dave