- Home
- :
- All Communities
- :
- Developers
- :
- JavaScript Maps SDK
- :
- JavaScript Maps SDK Questions
- :
- Re: Precision of labels in GenerateRendererParamet...
- Subscribe to RSS Feed
- Mark Topic as New
- Mark Topic as Read
- Float this Topic for Current User
- Bookmark
- Subscribe
- Mute
- Printer Friendly Page
Precision of labels in GenerateRendererParameters
- Mark as New
- Bookmark
- Subscribe
- Mute
- Subscribe to RSS Feed
- Permalink
- Report Inappropriate Content
  function generateClassBreaks(c1, c2) {
    var classDef = new ClassBreaksDefinition();
    classDef.classificationField = classBreakField;
    classDef.classificationMethod = "quantile";
    classDef.breakCount = interval;  //defined as 5

    var colorRamp = new AlgorithmicColorRamp();
    colorRamp.fromColor = new Color.fromHex(c1);
    colorRamp.toColor = new Color.fromHex(c2);
    colorRamp.algorithm = "hsv"; // options are:  "cie-lab", "hsv", "lab-lch"

  classDef.baseSymbol = new SimpleFillSymbol("solid", null, null);
  classDef.baseSymbol = defaultSymbol;
  classDef.colorRamp = colorRamp;

    var params = new GenerateRendererParameters();
    params.classificationDefinition = classDef;
    params.precision = 2;
    params.formatLabel = true;
    var clauseInput = classDef.classificationField;
    params.where= clauseInput + " > 0";
    var generateRenderer = new GenerateRendererTask(myLayer.url+"/0");
    generateRenderer.on("error", taskErrorHandler);
    generateRenderer.execute(params, applyRenderer);
  }
This is then used to generate my legend. In my legend, the values are not rounded to two decimal places like I expected. Instead they round to a whole number. They're this way because that's how the label got generated from the generateRendererTask.
I have worked around this by creating my own labels using the minValue and maxValue for each class, but I don't feel like I should have had to do this. I read in the API reference that precision is only for ClassBreakRenderers, but it seems like should be inclusive of the tools that let you generate those renderers dynamically.
This seems like a bug to me. I didn't get an error defining a precision parameter, just this unintended format. Has anyone else had a similar experience?
- Mark as New
- Bookmark
- Subscribe
- Mute
- Subscribe to RSS Feed
- Permalink
- Report Inappropriate Content
I'm running into a similar problem where I have a ClassBreaksDefinition set for a GenerateRendererTask but the labels only show integer values. This is a problem because the data is a percentage decimal value (ex. 0.0288). I've similarly tried to set the "precision" parameter of the GenerateRendererParameters object with no success. The classes are constructed accurately (I think) for the map display, but the legend presents five classes like the image below: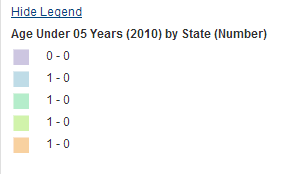
I'm also going to investigate the solution proposed in this post:
https://community.esri.com/message/340423?sr=search&searchId=d91d043f-1bc6-4c40-ae1d-b45426e549fa&se...
which calls for modifying the Legend dijit I think.
It does seem like the "precision" parameter of the GenerateRendererParameters object doesn't seem to work properly. It would be nice if an ESRI rep would weigh in on this...
Andrew
- Mark as New
- Bookmark
- Subscribe
- Mute
- Subscribe to RSS Feed
- Permalink
- Report Inappropriate Content
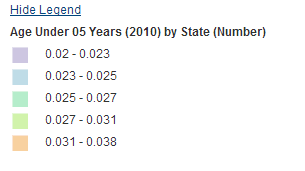
It seems that if you remove the "precision" parameter than at least in my case the labels now show up "properly". I did have to add the "formatLabel" property to the GenerateRendererParameters object, however. Now it would be great if I could get the image below to show up with Percentage values. i.e. "2.3%" rather than "0.023".
| var params = new GenerateRendererParameters(); | |
| params.classificationDefinition = classDef; | |
| //params.precision = 5; | |
| params.formatLabel = true; | |
| var generateRenderer = new GenerateRendererTask(dynamicUrl, { "source": layerSource }); | |
| generateRenderer.execute(params, this.applyRenderer, this.errorHandler); |
Does anyone have suggestions for formatting percent values in a legend label?
Andrew
- Mark as New
- Bookmark
- Subscribe
- Mute
- Subscribe to RSS Feed
- Permalink
- Report Inappropriate Content
I was specifically trying to get to 2, so leaving the precision parameters out wasn't a solution. The only way I've been able to manipulate the legend the way I wanted was to create it from scratch, making my own rectangles, text etc. I am putting the formatted label string into an array, labelArray, and then pulling them out in the createLegend function. You ought to be able to build a formatLabel function that takes itm.minValue and itm.maxValue as input to format it the way you want before it goes into labelArray. I pretty much had to do this anyway because I wanted a value for "No Data' and the ability to add some extra legend notes.
Continuing with the functions I have earlier, here's the results handler for the generateClassBreaks function. I go on to generate the legend manually.
  function applyRenderer(renderer) {
    var optionsArray = [];
    renderer.defaultSymbol = defaultSymbol;
    var drawingOptions = new LayerDrawingOptions();
    drawingOptions.renderer = renderer;
    optionsArray[0] = drawingOptions;
    agLayer.setLayerDrawingOptions(optionsArray);

    getInfoFromRender(renderer);//creates arrays the legend will use
   createLegend();
  }
  function getInfoFromRender(renderer){
    symbolArray.length = 0;
    labelArray.length = 0;
    arrayUtils.forEach (renderer.infos, function (itm) {
      symbolArray.push(itm.symbol);
      var val = itm.minValue + " - " + itm.maxValue;
     // labelArray.push(itm.label);
     labelArray.push(val);
    });
  }
// create legend based on symbology defined in code
 function createLegend() {
 //   var divLegend = dom.byId("legendDiv");
    domConstruct.empty("legendDiv");
    var note = dom.byId('mapHeader').innerHTML;
    //change the size of the surface as needed, example: if labels are wider or there are more than 5 intervals
        var legendSurface = gfx.createSurface(dom.byId("legendDiv"), 250, 200);
        var group = legendSurface.createGroup();
       yPos = 20;
      var descriptors, legendText;
      //symbolArray created as part of the generateRendererTask
      arrayUtils.forEach(symbolArray, function (itm, idx){
        descriptors = jsonUtils.getShapeDescriptors(itm);
          group.createRect({x: 10, y: yPos, width: 30, height: 20 }).
             setFill(descriptors.fill).
             setStroke(descriptors.stroke);
           //labelArray created as part of teh generateRendererTask
            legendText = group.createText({ x:45, y:yPos + 15, text:labelArray[idx], align:"start"}).
            setFont({ family:"Arial", size:"10pt", weight:"normal" }).
            setFill("#000000");
            yPos = yPos + 25;
    });
     // when data value = -999, symbolize as Data Not Available
      group.createRect({x: 10, y: yPos, width: 30, height: 20 }).
           setFill(jsonUtils.getShapeDescriptors(defaultSymbol).fill).
           setStroke(jsonUtils.getShapeDescriptors(defaultSymbol).stroke);
            legendText = group.createText({ x:45, y:yPos + 15, text:"Data Not Available", align:"start"}).
            setFont({ family:"Arial", size:"10pt", weight:"normal" }).
            setFill("#0000");
            yPos = yPos + 25;
      dom.byId("legendTitle").innerHTML = note +"<br/><i>Percent Total Area Treated</i> " ;
      registry.byId('legendPane').set("open", true);
}
- Mark as New
- Bookmark
- Subscribe
- Mute
- Subscribe to RSS Feed
- Permalink
- Report Inappropriate Content
Great work here, Tracy!
Can you share the rest of your HTML? I am having trouble with the last line in the code shown above. Do I need a dijit widget?
Thanks...Chris
- Mark as New
- Bookmark
- Subscribe
- Mute
- Subscribe to RSS Feed
- Permalink
- Report Inappropriate Content
I added params.unitLabel = "%"; under
var params = new GenerateRendererParameters();
and it puts a % at the end of the line, though the first number in the range doesn't get one.
- Mark as New
- Bookmark
- Subscribe
- Mute
- Subscribe to RSS Feed
- Permalink
- Report Inappropriate Content
This chunk of code would have been just a piece of functionality that I rolled into a larger project. The legendPane is a TitlePane that was nested within a dijit/layout/ContentPane. I often use them as a method of organizing my tools when I have too many to fit into my sidebar.
I think that functionality is still part of this project: Application of Agriculture Chemicals
- Mark as New
- Bookmark
- Subscribe
- Mute
- Subscribe to RSS Feed
- Permalink
- Report Inappropriate Content
Thanks, Tracy.
- Mark as New
- Bookmark
- Subscribe
- Mute
- Subscribe to RSS Feed
- Permalink
- Report Inappropriate Content
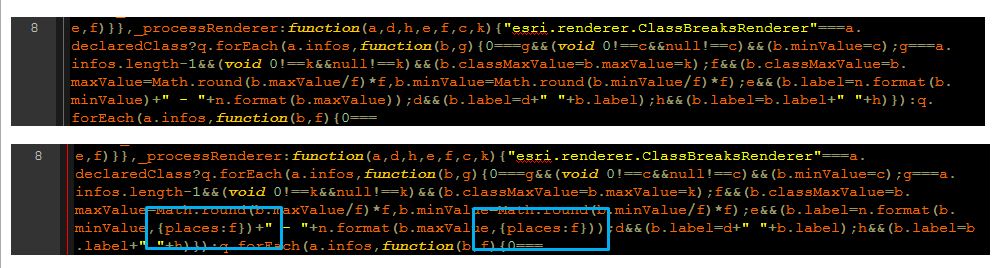
Hi there.
I'm sure it's not recommended, but I was able to fix this by editing line in the GenerateRendererTask.js in our hosted 3.14 library.