- Home
- :
- All Communities
- :
- Products
- :
- ArcGIS Maritime
- :
- ArcGIS Maritime Questions
- :
- Re: S-57 Display and Choosing Loaded ENCs
- Subscribe to RSS Feed
- Mark Topic as New
- Mark Topic as Read
- Float this Topic for Current User
- Bookmark
- Subscribe
- Mute
- Printer Friendly Page
- Mark as New
- Bookmark
- Subscribe
- Mute
- Subscribe to RSS Feed
- Permalink
- Report Inappropriate Content
Good afternoon all:
I am running into a glitch of sorts with displaying S-57 ENC charts in ArcMap, but first a bit of background. While I am experienced in ArcGIS, I have only recently begun using the Maritime Charting/Bathy extensions. That said, I had no trouble setting up my Nautical environment. Before deciding to post the following question, I have researched as much ESRI Help material online as I was able to find (including all the Charting/Bathy tutorial videos from Mrinmayee Bharadwaj and Bertrand Baud), and have been unable to find a solution.
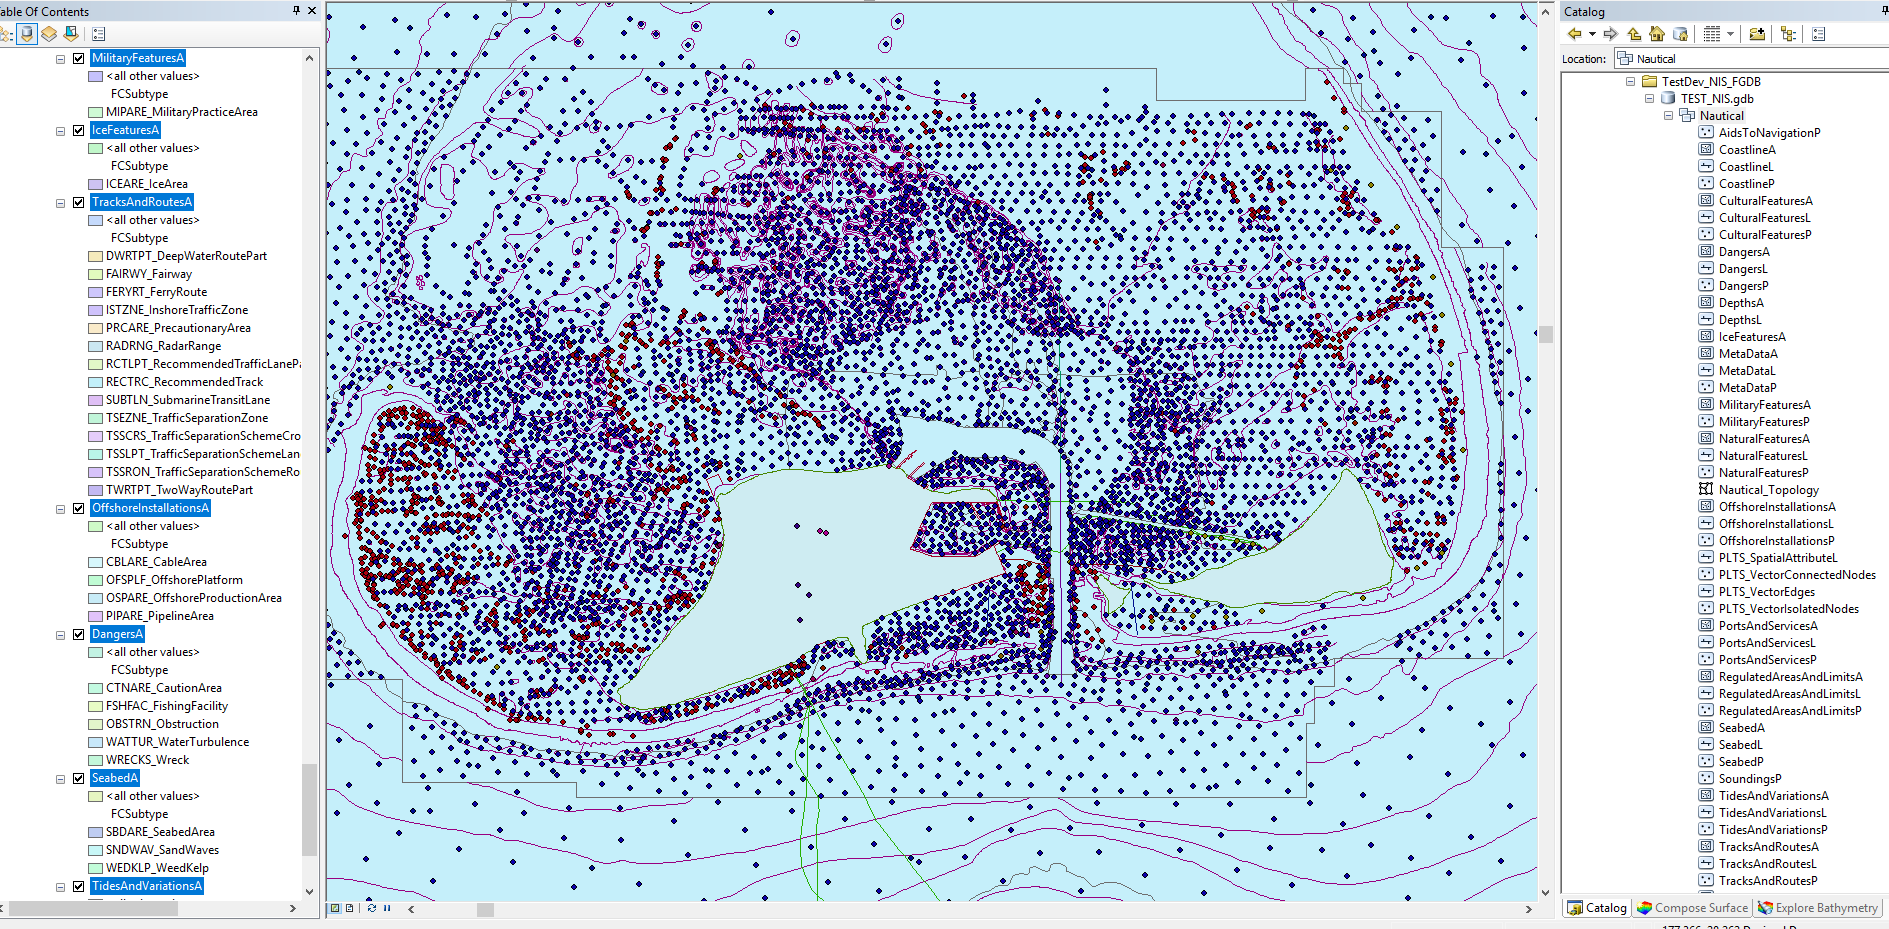
1. When I load a chart on my Maritime-enabled machine, the display looks like this (1:40,000, all layers except M_QUAL_A enabled):
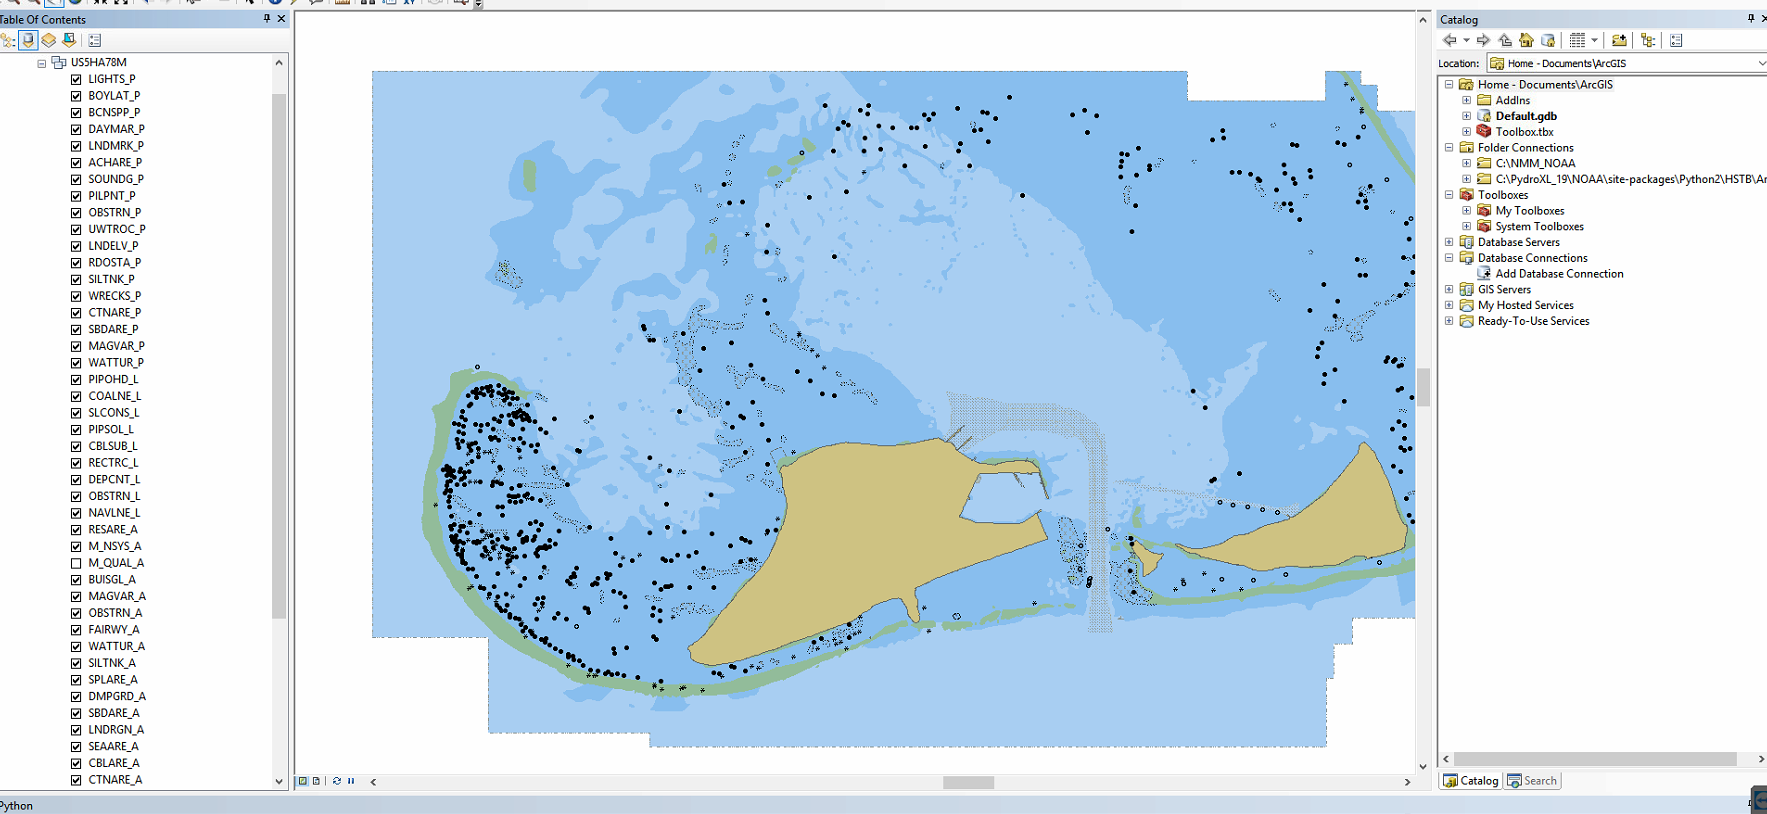
However, when I load the same chart on another machine that only has the ESRI S-57 Viewer installed, it looks more like what I would expect, (also 1:40,000 with all layers except M_QUAL_A enabled):
I suspect this is a simple fix, but I am unsure how to proceed; I could use a shove in the right direction. I am running ArcGIS 10.7.0.1045, with the full Maritime Charting and Bathy extensions enabled. I imported these charts using the 'Import S-57 to Geodatabase' tool, and displaying the NAUTICAL featureset. My NIS is a FGDB using the the NAUTICAL_ENC_TEMPLATE_VXXXXXXXX_GX.XML for its schema.
2. The S-57 Viewer allows me to explicitly choose which charts to load and display, (see second image above). However, I see no such control when using the charting extension. I can load charts into the NIS with the 'Import S-57...' tool, but I see no way to choose which charts to actually display on the map.
Thank you for your time.
--Nate Murry
Solved! Go to Solution.
Accepted Solutions
- Mark as New
- Bookmark
- Subscribe
- Mute
- Subscribe to RSS Feed
- Permalink
- Report Inappropriate Content
Hi Nate,
The NIS isn't really designed for viewing ENCs in the traditional ECDIS sense. It's really made to take navigational S-57 data and transform it into GIS data.
If you want to symbolize the data like ENC, there are tools you can run on the geodatabase so that it looks more like an ECDIS display. I can help you with that. There are even python script tools on GitHub that automate this process, like S-57 to GIS:
On the same note, there are not tools for isolating a single cell out of the NIS, as the NIS isn't really meant to represent ENC cells, just data.
However, there are ways in which you could isolate date by extent (choose a metadata polygon feature from a specific dataset and clip to shape). Or, you could use the attributes to place a definition query on the layers based on the dataset name attribute (which stores the name of the S-57 cell that the data originally came from).
Please feel free to reach out to me directly at cgreene@esri.com and I can provide you with more detailed information, and also probably ask you a few questions to see if there is a better/best way to help you achieve your end goal.
thanks - craig
- Mark as New
- Bookmark
- Subscribe
- Mute
- Subscribe to RSS Feed
- Permalink
- Report Inappropriate Content
Thanks for your query Nate! ArcGIS Maritime team will get in touch with you soon.
- Mark as New
- Bookmark
- Subscribe
- Mute
- Subscribe to RSS Feed
- Permalink
- Report Inappropriate Content
Hi Nate,
The NIS isn't really designed for viewing ENCs in the traditional ECDIS sense. It's really made to take navigational S-57 data and transform it into GIS data.
If you want to symbolize the data like ENC, there are tools you can run on the geodatabase so that it looks more like an ECDIS display. I can help you with that. There are even python script tools on GitHub that automate this process, like S-57 to GIS:
On the same note, there are not tools for isolating a single cell out of the NIS, as the NIS isn't really meant to represent ENC cells, just data.
However, there are ways in which you could isolate date by extent (choose a metadata polygon feature from a specific dataset and clip to shape). Or, you could use the attributes to place a definition query on the layers based on the dataset name attribute (which stores the name of the S-57 cell that the data originally came from).
Please feel free to reach out to me directly at cgreene@esri.com and I can provide you with more detailed information, and also probably ask you a few questions to see if there is a better/best way to help you achieve your end goal.
thanks - craig
- Mark as New
- Bookmark
- Subscribe
- Mute
- Subscribe to RSS Feed
- Permalink
- Report Inappropriate Content
Good evening Craig:
Thank you for getting back to me, and for the helpful information. I had a suspicion that what you said might be the case (the NIS is essentially overkill for what I am doing).
For the benefit of other users, I am only looking to load ENC charts into ArcMap for reference maps and analysis products, I am not doing any actual chart development. In the meantime, I tested out the ESRI S-57 Viewer, and that appears to give me the solutions I need, (basic loading/viewing/manipulating ENC charts in ArcMap). I am not positive that is the best solution, but it seems to be right now.
I will reach out to you by email tomorrow (8/28) with some further details and make sure I am using the best solutions. Thanks again for getting back to me.
--Nate Murry
- Mark as New
- Bookmark
- Subscribe
- Mute
- Subscribe to RSS Feed
- Permalink
- Report Inappropriate Content