- Home
- :
- All Communities
- :
- Products
- :
- ArcGIS Monitor
- :
- ArcGIS Monitor Questions
- :
- Re: Monitor Dashboards & Pinch Points
- Subscribe to RSS Feed
- Mark Topic as New
- Mark Topic as Read
- Float this Topic for Current User
- Bookmark
- Subscribe
- Mute
- Printer Friendly Page
- Mark as New
- Bookmark
- Subscribe
- Mute
- Subscribe to RSS Feed
- Permalink
- Report Inappropriate Content
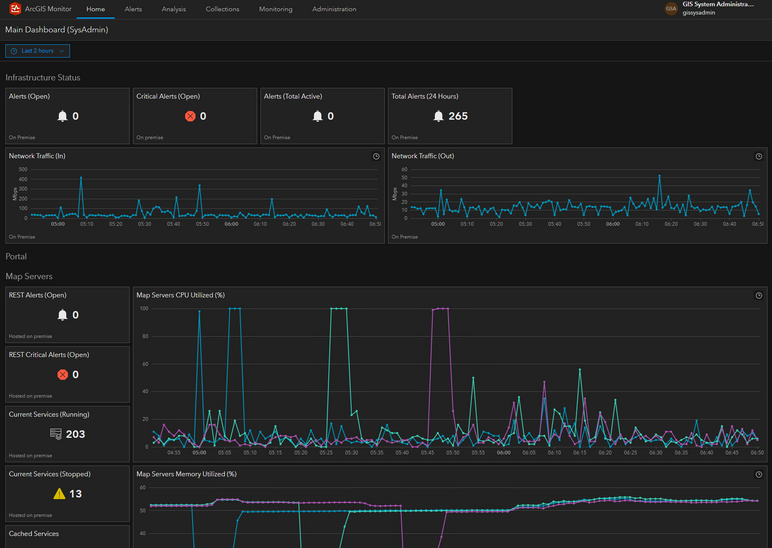
Share your dashboard(s) to give each other some ideas as to what is possible. Along with that, post your pinch points where you are having difficulties.
NOTE: If anyone needs to see how I put together some of my metrics, post a comment. Happy to share.
My specific pinch points are...
- You can monitor Portal, but it does not pick up the sub components (eg. Host, Datastores, etc.)
- You cannot monitor federated host servers if you have turned off the primary site administrator (PSA) as Host servers.
- Monitor thinks all servers are Host servers.
- It would be great if we could have some pre-built options to show Kbps vs. Mbps vs. Gbps or at least let us add in math for things like that.
- Some pre-built examples would be great so we have a patterns to look at, ie. for a host server you can get published service counts by doing X, for Portal you can get item counts by doing Y, etc..etc.
Outside of those couple of items, what an amazing improvement! Supremely happy with the results and am enjoying the rigors of putting together dumbed down dashboards for management to have eyes on with.
Value added item....if possible:
Could we make it possible to hook in ArcGIS Online only to pull things like Total numbers of users, Total number of items in the org, etc...etc. Perhaps even being able to monitor the RSS feed for issues would be great. Having 1 system that can monitor the entire Enterprise would be supremely helpful.
Solved! Go to Solution.
Accepted Solutions
- Mark as New
- Bookmark
- Subscribe
- Mute
- Subscribe to RSS Feed
- Permalink
- Report Inappropriate Content
Greetings,
Thank you for this post! I recently finished setting up and configuring ArcGIS Monitor 2023.2, and I am beginning to work on some dashboards. My Major pinch point is figuring out where to start. I have all of the collections made, and can add those to AGE, that's pretty straight forward. I think I know what I want to see in a dashboard, and migrating that incomplete thought, to the data, to dashboard is proving to be a bit of a challenge. I would love to take you up on your offer and see how you put together some of your metrics. I think I just need a nudge to become productive and build a dashboard. Thank you for everything and have a delightful day.
Sincerely,
Joe Guzi
- Mark as New
- Bookmark
- Subscribe
- Mute
- Subscribe to RSS Feed
- Permalink
- Report Inappropriate Content
John, the dashboards look awesome and this is really great feedback. Thank you for taking the time to share!
- Mark as New
- Bookmark
- Subscribe
- Mute
- Subscribe to RSS Feed
- Permalink
- Report Inappropriate Content
Thanks for sharing your feedback @John_Spence , we appreciate it. Your metric charts look nice.
> Could we make it possible to hook in ArcGIS Online only to pull things like Total numbers of users, Total number of items in the org, etc...etc.
I will add your name to the enhancement list. 🙂 This is under consideration, but we have much to do beforehand.
- Mark as New
- Bookmark
- Subscribe
- Mute
- Subscribe to RSS Feed
- Permalink
- Report Inappropriate Content
I figured you had it on the road map somewhere. I am still digging deeply into what it can/cannot do and it is a huge leap forward. I know I am just one voice on this, but I am sure the community at large is trying to wrap their head around how flexible it is, not to mention capable.
- Mark as New
- Bookmark
- Subscribe
- Mute
- Subscribe to RSS Feed
- Permalink
- Report Inappropriate Content
Greetings,
Thank you for this post! I recently finished setting up and configuring ArcGIS Monitor 2023.2, and I am beginning to work on some dashboards. My Major pinch point is figuring out where to start. I have all of the collections made, and can add those to AGE, that's pretty straight forward. I think I know what I want to see in a dashboard, and migrating that incomplete thought, to the data, to dashboard is proving to be a bit of a challenge. I would love to take you up on your offer and see how you put together some of your metrics. I think I just need a nudge to become productive and build a dashboard. Thank you for everything and have a delightful day.
Sincerely,
Joe Guzi
