- Home
- :
- All Communities
- :
- Products
- :
- ArcGIS Pro
- :
- ArcGIS Pro Questions
- :
- Re: Remove duplicate legend items
- Subscribe to RSS Feed
- Mark Topic as New
- Mark Topic as Read
- Float this Topic for Current User
- Bookmark
- Subscribe
- Mute
- Printer Friendly Page
Remove duplicate legend items
- Mark as New
- Bookmark
- Subscribe
- Mute
- Subscribe to RSS Feed
- Permalink
- Report Inappropriate Content
How can I remove all the duplicate legend items?
- Mark as New
- Bookmark
- Subscribe
- Mute
- Subscribe to RSS Feed
- Permalink
- Report Inappropriate Content
Brian,
Can you share more about what you have going on here? What does your table of contents look like? How many layers are being represented in your legend? Have you gone through all of the settings of the legend in Pro? There are many suggested settings and topics in this article: Work with a legend—Layouts | ArcGIS Desktop
- Mark as New
- Bookmark
- Subscribe
- Mute
- Subscribe to RSS Feed
- Permalink
- Report Inappropriate Content
Adrian,
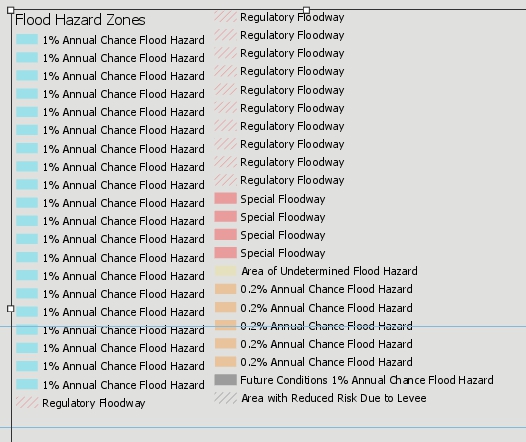
Here is a screen shot of the legend.

Notice that the 1% Annual Chance shows up 20 times, the Regulatory Floodway shows up 11 times, the Special Floodway shows up 4 times, and the 0.2% Annual Chance shows up 5 times. What I would like is for each of these to only appear once. This is public NFHL data from the FEMA REST site Layer: Flood Hazard Zones (ID: 28)
I've tried all the setting on Pro that I could. By looking at the table of content, my best guess is that the FEMA Flood Hazard data has the 1% Annual Chance data broken into 20 records for the current extent and that is why it shows 20 times.
Here is a screen shot showing the layer in the table of contents.

I'm seeing now that what shows in the table of contents is what is showing in the legend, and that does make sense. I was hoping to use the REST URL because then the floodplain would update when FEMA updates it. Instead I've got to download the digital data, apply whatever symbology I want, and then create a legend. But then I've got to keep an eye on the data because if it gets updated, then I have to download the new data, and point the layer to that new downloaded data.
I'd say the problem is not the legend, but the data.
I should have looked at the table of contents before asking the question.
Thank you for looking at my question.
Brian Anderson
- Mark as New
- Bookmark
- Subscribe
- Mute
- Subscribe to RSS Feed
- Permalink
- Report Inappropriate Content
Brian, Adrian Welsh is right that the legend is simply reflecting the layers you have in the map. What you can do, though is right-click the legend, Convert to Graphics, and manually delete duplicate layers in there. Work with a legend item—Layouts | ArcGIS Desktop Heed the advice in the help "Once you convert a map element into a graphic, it is no longer connected to its original data and will not respond to changes made to the map. For instance, if you decide to add another layer to the map after the legend has been converted to a graphic, the legend will not automatically update. Therefore, it is a good idea to convert elements to graphics only after your map's layers and symbology are finalized."
Hope this helps.
- Mark as New
- Bookmark
- Subscribe
- Mute
- Subscribe to RSS Feed
- Permalink
- Report Inappropriate Content
Thanks Kory, great advise. It will be easier to "play with the graphics" then what I was trying to do.