- Home
- :
- All Communities
- :
- Products
- :
- ArcGIS Pro
- :
- ArcGIS Pro Questions
- :
- Re: Summary Statistics Popup?
- Subscribe to RSS Feed
- Mark Topic as New
- Mark Topic as Read
- Float this Topic for Current User
- Bookmark
- Subscribe
- Mute
- Printer Friendly Page
- Mark as New
- Bookmark
- Subscribe
- Mute
- Subscribe to RSS Feed
- Permalink
- Report Inappropriate Content
In ArcMap we used to be able to right-click on a field in a table and get the stats for it: Sum, mean, etc. as a popup.
I can't figure out how to do this in Pro.
The two current options are either: 1)make a chart or 2) run the summary statistics GP tool
I just want a quick snapshot; I don't want to mess around with charts or make a whole new table just to find out the sum of a field to answer a quick question about acreage.
Is that popup behavior still present somewhere?
Solved! Go to Solution.
Accepted Solutions
- Mark as New
- Bookmark
- Subscribe
- Mute
- Subscribe to RSS Feed
- Permalink
- Report Inappropriate Content
This is what I get when i right click a field name in Pro, the explore statistics and visualize statistics options are possibly what you are looking for but not seeing?
- Mark as New
- Bookmark
- Subscribe
- Mute
- Subscribe to RSS Feed
- Permalink
- Report Inappropriate Content
This is what I get when i right click a field name in Pro, the explore statistics and visualize statistics options are possibly what you are looking for but not seeing?
- Mark as New
- Bookmark
- Subscribe
- Mute
- Subscribe to RSS Feed
- Permalink
- Report Inappropriate Content
Maybe they added it back in in 3.2? I'm still on 3.1 so that may be it.
Would you mind clicking on that and sharing a screenshot to confirm that that's what I'm thinking of?
- Mark as New
- Bookmark
- Subscribe
- Mute
- Subscribe to RSS Feed
- Permalink
- Report Inappropriate Content
confirming i am on 3.2.2
it opens a new table like object rather than a pop up - docks it right next to the attribute table and it looks like this:
- Mark as New
- Bookmark
- Subscribe
- Mute
- Subscribe to RSS Feed
- Permalink
- Report Inappropriate Content
I guess that'll work? Does it create an item in the Contents Pane as well? (Please say no)
- Mark as New
- Bookmark
- Subscribe
- Mute
- Subscribe to RSS Feed
- Permalink
- Report Inappropriate Content
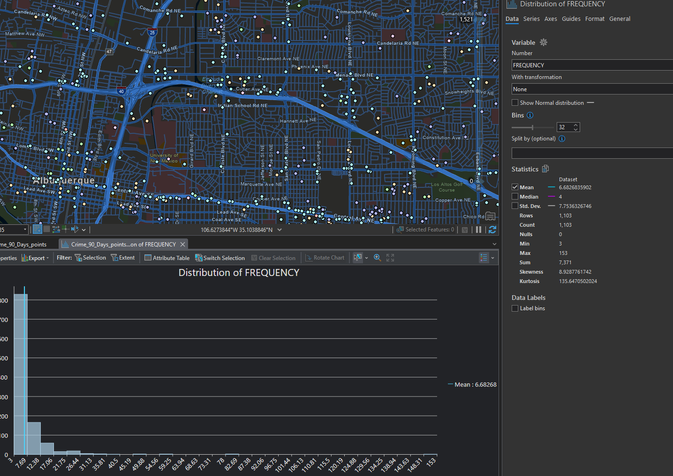
Your wish is granted: no, no new content is created that shows up in the contents window. If you use the 'visualize statistics' tool though you get a chart that opens up next to the attribute table and then a 'contents property' panel with some of the statistics information shown as well as in this screen shot. But still nothing new under the ToC.
- Mark as New
- Bookmark
- Subscribe
- Mute
- Subscribe to RSS Feed
- Permalink
- Report Inappropriate Content
Woohoo. I'll be looking forward to our next update.
Thanks!
- Mark as New
- Bookmark
- Subscribe
- Mute
- Subscribe to RSS Feed
- Permalink
- Report Inappropriate Content
It's closer to the old ArcMap statistics popup than the previous version, but I still prefer the ArcMap popup to the new Explore Statistics functionality (and I am not a Pro-hater... I've been using Pro for years and this is really the only thing I miss). The thing I miss most is that it was just a temporary popup that disappeared when you were done with it, rather than being another table you have to close. Also, if I remember correctly, it showed the total and the selection side by side, which was helpful for comparison purposes. The Explore Statistics table only shows the selection OR the total (when there is no selection). And you have to click Calculate to get it to refresh for each new selection. Plus the ArcMap popup showed everything in one glance, whereas with Explore Statistics I always have to scroll right to see the Sum column, which is what I want to see 90% of the time.
- Mark as New
- Bookmark
- Subscribe
- Mute
- Subscribe to RSS Feed
- Permalink
- Report Inappropriate Content
Its a little weird and cumbersome to me that there are two 'statistics' options - there doesn't seem to be anything in the 'visualize statistics' option that isn't in the 'explore statistics' option. The visualize tool lets you see the selection compared to the entire table and shows those in the side panel which i find more useful because i can see all of the information at a glance than the tabular view opened by the plain ol' explore tool which makes me have to scroll to see the data.


