- Home
- :
- All Communities
- :
- Products
- :
- ArcGIS Spatial Analyst
- :
- ArcGIS Spatial Analyst Questions
- :
- Re: ArcGIS Pro Nibble tool problem
- Subscribe to RSS Feed
- Mark Topic as New
- Mark Topic as Read
- Float this Topic for Current User
- Bookmark
- Subscribe
- Mute
- Printer Friendly Page
- Mark as New
- Bookmark
- Subscribe
- Mute
- Subscribe to RSS Feed
- Permalink
- Report Inappropriate Content
I have a wawe intensity raster with gaps (NoData), and I want to Nibble the NoData pixels from neighbouring pixel values (wawe intensity values) in ArcGIS Pro, using a separate sea water mask covering the NoData areas (pixels in dark blue). The two raster are 32 bits floating point rasters and have identical raster statistics, extents and projection. In addition all the required env. variables seems to be correctly defined. The Nibble tools performs well without any error messages. BUT the output is a raster with values from -3.4 to +3.4. The same problem occurs when I use the Focal Statistics tool... same problems with integer rasters, Nibble output 0-255. The floating output raster has the same size 2.8 GB, so there are some data in there.. I have also built new pyramids and calculated raster statistics without any improvements..
Any ideas why this is so, and how to solve this problem? 
Best regards,
Frank
Solved! Go to Solution.
Accepted Solutions
- Mark as New
- Bookmark
- Subscribe
- Mute
- Subscribe to RSS Feed
- Permalink
- Report Inappropriate Content
Dear Curtis!
Thanks for advising me to use GRIDs.
I solved the problem (went back to ArcGIS 10.17 as I am still most familiar with that SW).
- First I converted all NoData wawe-pixels to 0 to allow the Nibble tool too do the interpolation (within the coastal zone area).
- I then used this converted layer as the input raster to the Nibble-tool.
- The original wawe-raster (with its NoData pixels) aim as the input raster mask. The Nibble output gave me the intended result, as visualized in the enclosed images.
Best regards,
Frank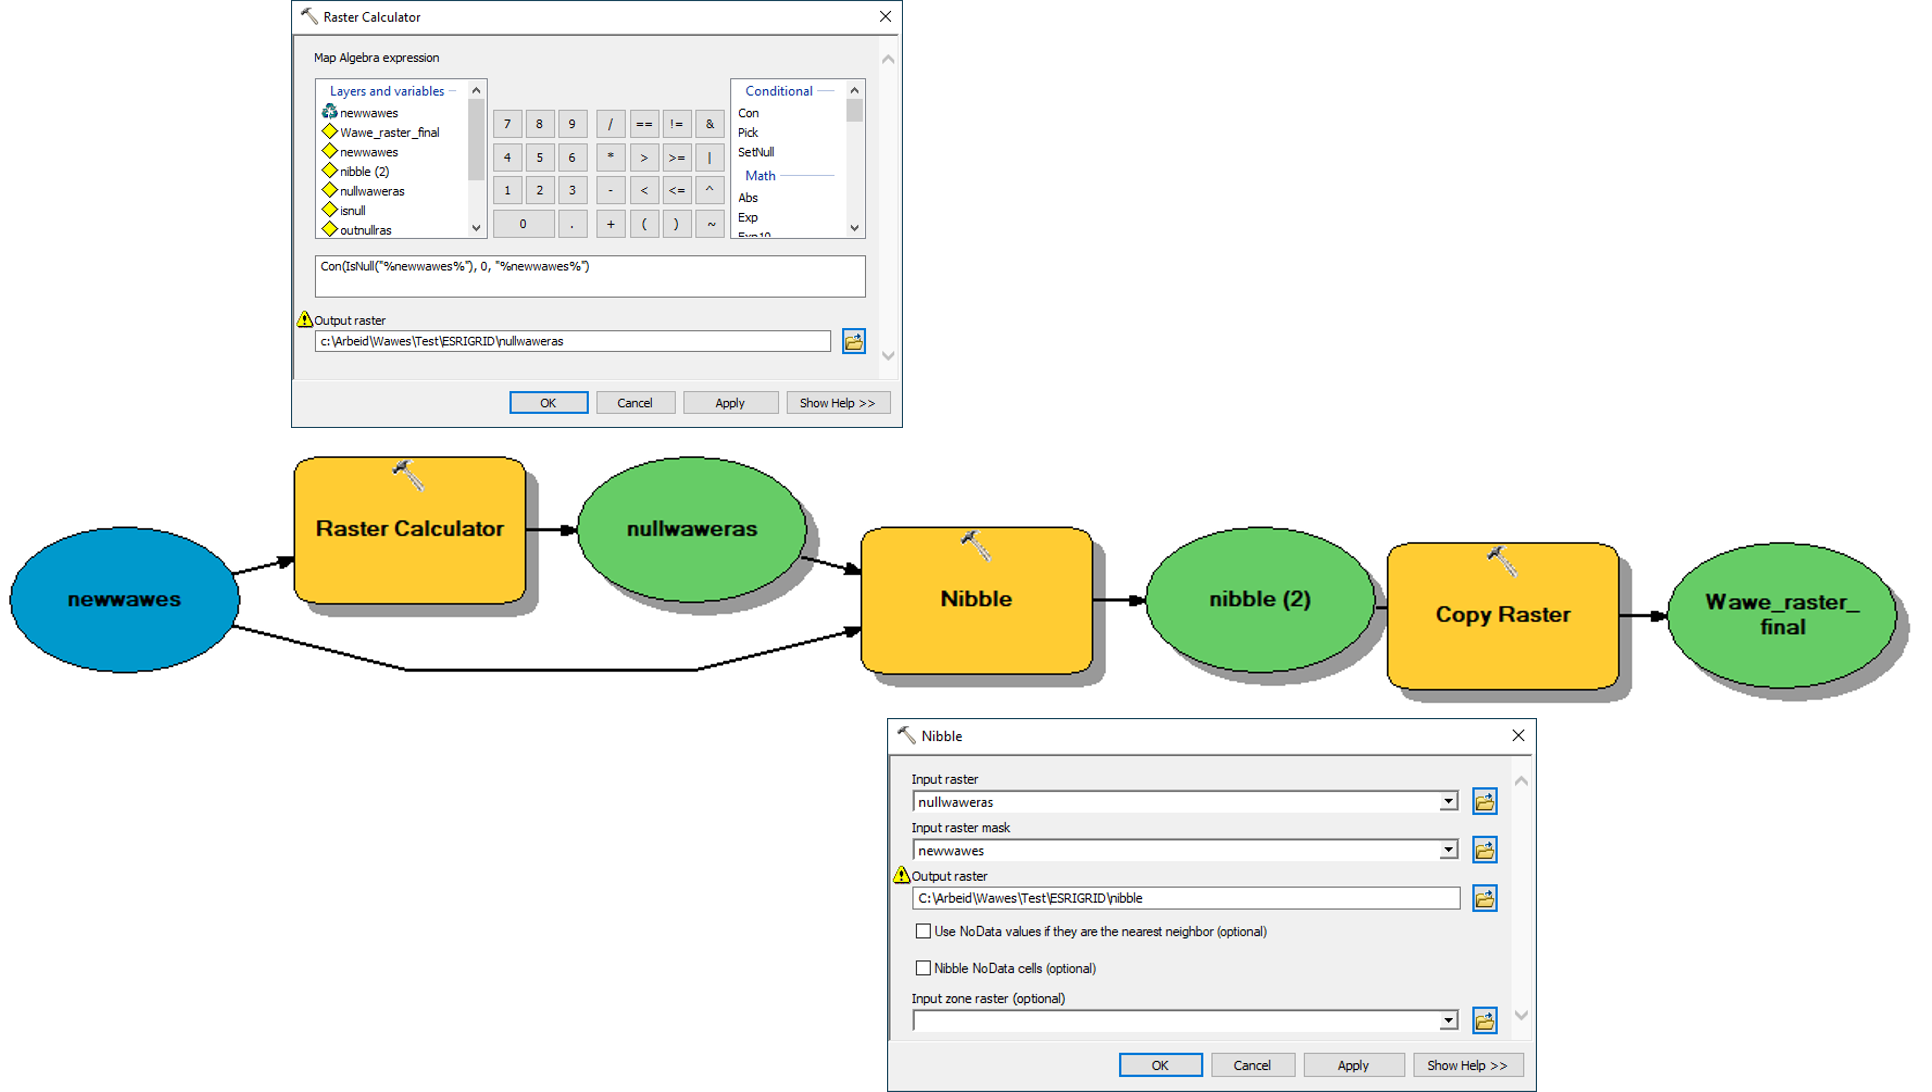
- Mark as New
- Bookmark
- Subscribe
- Mute
- Subscribe to RSS Feed
- Permalink
- Report Inappropriate Content
A couple questions - what's the output format of your raster dataset? If it's a standalone GRID, try to set the output raster to a file geodatabase format. Also, what is the data in projected or geographic coordinate systems?
- Mark as New
- Bookmark
- Subscribe
- Mute
- Subscribe to RSS Feed
- Permalink
- Report Inappropriate Content
Hi Robert!
All input rasters are within the same file geodatabase as the output file, and they are all in a projected coordinate system (ETRS 1989 UTM Zone 33N)
Best regards,
Frank
- Mark as New
- Bookmark
- Subscribe
- Mute
- Subscribe to RSS Feed
- Permalink
- Report Inappropriate Content
Frank, it might be useful to show the input rasters. I presume that you have a basemap on and it doesn't represent the landmass exactly
- Mark as New
- Bookmark
- Subscribe
- Mute
- Subscribe to RSS Feed
- Permalink
- Report Inappropriate Content
The input rasters are shown in the image above, Wawe intensity (green to red) and the NoData Mask (dark blue) Alle the data is within the coastal area region of interest.
- Mark as New
- Bookmark
- Subscribe
- Mute
- Subscribe to RSS Feed
- Permalink
- Report Inappropriate Content
The reason I asked is that the nodata mask (dark blue) appears to be at a much finer resolution that the other raster. I guess I was hoping for a zoomed in location to see what was going on
- Mark as New
- Bookmark
- Subscribe
- Mute
- Subscribe to RSS Feed
- Permalink
- Report Inappropriate Content

- Mark as New
- Bookmark
- Subscribe
- Mute
- Subscribe to RSS Feed
- Permalink
- Report Inappropriate Content
They both have the same spatial resolution 50 x 50 meters (land pixels in white)
- Mark as New
- Bookmark
- Subscribe
- Mute
- Subscribe to RSS Feed
- Permalink
- Report Inappropriate Content
The wawe intensity raster is from remote sensing
- Mark as New
- Bookmark
- Subscribe
- Mute
- Subscribe to RSS Feed
- Permalink
- Report Inappropriate Content
but the wawe intensity, is it a single band raster?
In any event, did you try to change the 3rd parameter PROCESS_NODATA ? instead of the default.
I will flag Steve Lynch who might have better insight on this