- Home
- :
- All Communities
- :
- Industries
- :
- Education
- :
- Education Blog
- :
- Fun with GIS 225: Crowdsourcing Maria
Fun with GIS 225: Crowdsourcing Maria
- Subscribe to RSS Feed
- Mark as New
- Mark as Read
- Bookmark
- Subscribe
- Printer Friendly Page
- Report Inappropriate Content
On September 20, 2017, Hurricane Maria slammed into Puerto Rico, pummeling the island's people, human infrastructure, and natural environment. In following weeks, companies gathered aerial imagery which multiple organizations used to understand the damage and help plan and coordinate the rescue and recovery efforts. On Oct.11, using post hurricane Maria imagery facilitated generously by Vexcel, Esri made public a crowdsourcing tool for marking damage to buildings.
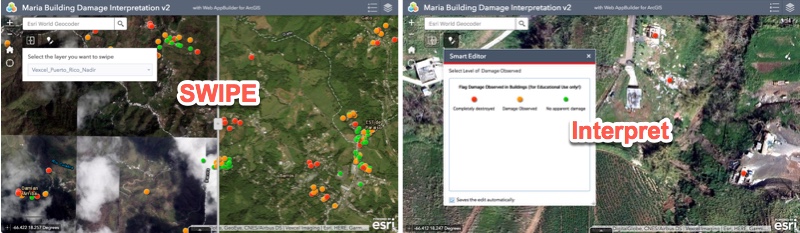
Through a simple swipe tool, users could see "before and after" imagery, then indicate with green/orange/red dots their interpretation of the damage. A publicly accessible video showed the entire process. Participants needed to join an ArcGIS Online group via an Organization-based login. Esri communicated directly with some educators and, on Oct.11, posted a public blog, inviting participation. An update blog followed a week later. Over the next month, users generated almost 70,000 entries.

Recent developments in technology have made public action easier, but "crowdsourcing" and "citizen science" have been around for a long time. Starting in 1900, the Audubon Christmas Bird Count has relied on community members recording observations according to a protocol. Today, both government and civic communities rely on -- and debate -- the merits of data generated by people who may or may not have the desired qualifications. Quality control and assurance are essential if the data are to be believed.
The data generated in the Maria project was impressive in quantity, but there were many entries about which people raised objections. Their number and distribution mean the entire data set would need manual confirmation and editing before being useful to the response community, which is too costly in human resources to do.
Education is an act of faith. Communities want young people to learn important background knowledge, skills, and values. Learners seek joy, which can come from extrinsic influences (e.g. earning praise, receiving a prize) or intrinsic influences (e.g. acquiring new knowledge, resolving confusion, developing a skill, making choices, influencing how someone feels, etc). Educators strive to optimize scores of competing forces (time, investments already in place versus those needed, expectations, mandates, learner engagement, individuals and groups, etc). Balancing these in the dynamic world of today means constant tradeoffs.
Esri had several goals in launching this project. We hoped learners, educators, and the public would see better how geographic data, tools, skills, and knowledge can generate benefit. We hoped participants would get joy, on multiple levels -- learning, participating, contributing. In an ideal result, the data would prove valuable for response teams. And we expected to learn, as we always do, from the experiences, ideas, and concerns of users.
Everyone learns by doing. Our lives are filled with imperfect attempts, at tasks large and small. But such "failures" yield important lessons, so we adjust and try again. Learning from "a missed swing" helps us all do better. So we hope you can help us one more time, below, by commenting below on this project (sign in to comment). If you chose not to participate, please tell us why. If you chose to participate, please tell us what the experience was like, what you learned, and what we should keep in mind for "next time." And if you're willing to share comments only in private, please send email "cfitzpatrick{at}esri.com." Thank you!
You must be a registered user to add a comment. If you've already registered, sign in. Otherwise, register and sign in.
-
Administration
39 -
Announcements
45 -
Career & Tech Ed
1 -
Curriculum-Learning Resources
180 -
Education Facilities
24 -
Events
47 -
GeoInquiries
1 -
Higher Education
520 -
Informal Education
266 -
Licensing Best Practices
47 -
National Geographic MapMaker
17 -
Pedagogy and Education Theory
187 -
Schools (K - 12)
282 -
Schools (K-12)
185 -
Spatial data
24 -
STEM
3 -
Students - Higher Education
232 -
Students - K-12 Schools
86 -
Success Stories
22 -
TeacherDesk
1 -
Tech Tips
83
- « Previous
- Next »