- Home
- :
- All Communities
- :
- Products
- :
- Geoprocessing
- :
- Geoprocessing Questions
- :
- Re: How to create a Polygon from a single point
- Subscribe to RSS Feed
- Mark Topic as New
- Mark Topic as Read
- Float this Topic for Current User
- Bookmark
- Subscribe
- Mute
- Printer Friendly Page
- Mark as New
- Bookmark
- Subscribe
- Mute
- Subscribe to RSS Feed
- Permalink
- Report Inappropriate Content
I'm trying to programmatically figure out how to create a polygon feature using just a single point. If my spatial reference is Web Mercator WGS84 and I want a 1 Meter by 2 Meter Polygon, how can I go about this? The point can be any Latitude Longitude, I just need to get an idea if this can be done or not. Thanks
Solved! Go to Solution.
- Mark as New
- Bookmark
- Subscribe
- Mute
- Subscribe to RSS Feed
- Permalink
- Report Inappropriate Content
Thanks Darren, I'll try this tomorrow morning
- Mark as New
- Bookmark
- Subscribe
- Mute
- Subscribe to RSS Feed
- Permalink
- Report Inappropriate Content
Darren, thanks for this. There were a lot of great answers below but this turned out to be what I needed. Thanks
- Mark as New
- Bookmark
- Subscribe
- Mute
- Subscribe to RSS Feed
- Permalink
- Report Inappropriate Content
Hi Joshua,
I'd say creating a polygon from a map click is certainly possible, but technicalities may be a bit different in ArcMap and the APIs.
When a user clickes a map, the map emits an on-click event. One of the properties of the parameter passed into the event handler is the point that was clicked. Take that point and calculate where the vertices of your polygon (like Darren suggested). I believe a map SilverLight (similarly to JavaScript) has one (or more) graphics layer(s), ideal for storing and displaying temporary geometries. Once you have your polygon, add it to the graphics layer.
Paste the code below into ArcGIS API for JavaScript Sandbox . Is it roughly what you want to do?
<!DOCTYPE html>
<html>
  <head>
    <meta http-equiv="Content-Type" content="text/html; charset=utf-8">
    <meta name="viewport" content="initial-scale=1, maximum-scale=1,user-scalable=no"/>
    <title>Polygon from map click</title>
    <link rel="stylesheet" href="http://js.arcgis.com/3.10/js/esri/css/esri.css">
    <style>
      html, body, #map { height: 100%; width: 100%; margin: 0; padding: 0; }
      body { background-color: #FFF; overflow: hidden; font-family: "Trebuchet MS"; }
      #help {position: absolute; top: 20px; right: 20px; z-index: 1001; background-color: white; padding: 10px;}
    </style>
    <script src="http://js.arcgis.com/3.10/"></script>
    <script>
      var map;

      require(["esri/map", "esri/graphic",
        "esri/geometry/webMercatorUtils",
        "esri/geometry/Polygon",
        "esri/symbols/SimpleFillSymbol",
        "dojo/on","dojo/domReady!"
      ], function(Map, Graphic, webMercatorUtils, Polygon, SimpleFillSymbol) {

        map = new Map("map", { basemap: "topo",center: [-92.0, 35.0], zoom: 9 });

        var symbol = new SimpleFillSymbol({
          "type": "esriSFS", "style": "esriSFSSolid", "color": [255,0,0,100],
          "outline": {"type": "esriSLS", "style": "esriSLSSolid", "color": [255,0,0,255],"width": 1}
        });

        map.on('click', function(evt){
          var pt = evt.mapPoint;
          var x = pt.x, y = pt.y;
          var dx = 500, dy = 1000; // THESE ARE JUST WEB MERKATOR UNITS NOW, NOT METRES!!!

          var polygon = new Polygon({"rings":[[
              [x - dx, y - dy], [x - dx, y + dy],
              [x + dx, y + dy], [x + dx, y - dy], [x - dx, y - dy]
            ]], "spatialReference": pt.spatialReference});

          //var pgwgs = webMercatorUtils.webMercatorToGeographic(polygon); // might come handy

          var gr = new Graphic(polygon, symbol);

          map.graphics.clear(); // may need to remove just a particular graphic
          map.graphics.add(gr);

        });

      });
    </script>
  </head>

  <body>
    <div id="help">Click on the map to create a polygon</div>
    <div id="map"></div>
  </body>
</html>
I won't get into details about handling different coordinate systems now, maybe when we know what you are after. Also, you could potentially buffer the point and get envelope of the buffer to get a rectangle which you could then adjust. At what scale are you working? When I set the size to 10x20, the polygon wasn't even visible unless I zoomed really close.
Filip.
- Mark as New
- Bookmark
- Subscribe
- Mute
- Subscribe to RSS Feed
- Permalink
- Report Inappropriate Content
Hi Filip, thanks for this. while your code is more detailed and looks like what I'm after, I'm going to attempt Darren's code above tomorrow morning. If I can't get that to work, I'll try yours next before accepting an answer. Thanks for fast reply
- Mark as New
- Bookmark
- Subscribe
- Mute
- Subscribe to RSS Feed
- Permalink
- Report Inappropriate Content
Filip, thank you for this. I am newbie with Arcgis for Javascript. What if I need to draw a polygon with exact height and width values? I cant find a way to do it. Any suggestion? thanks.
Damaso
- Mark as New
- Bookmark
- Subscribe
- Mute
- Subscribe to RSS Feed
- Permalink
- Report Inappropriate Content
Hi Otto,
If I understand you correctly, your problem is that my example above uses web mercator units but you need to define the coordinates in some more meaningful units like meters or feet. Well, doing that can be a little complicated. Projection of the map you are drawing on plays an important role, which I simplify in my explanation below.
If your map is in a projection that uses meters or feet, then the job is easy. Simpy define the polygon in the native units of the projection and it will draw correctly. It is more complicated if your map uses a projection like web mercator (where ground distance of a 1 cm long line on the map varies with location on the map and direction of measurement). I think the way to go is to define your polygon is some local projected coordinate system with meters or feet, then project that polygon to the projection of the map, and finally draw this projected polygon on the map. That is the short story. This example of projecting a point can help you (https://developers.arcgis.com/javascript/3/jssamples/util_project.html). Note that it uses ArcGIS Geometry service in the background. If you can't or don't want to use such service, the proj4js (http://proj4js.org/) library may be a good alternative.
Filip.
- Mark as New
- Bookmark
- Subscribe
- Mute
- Subscribe to RSS Feed
- Permalink
- Report Inappropriate Content
Okay...now you are describing a whole different problem. What you really want is to be able to click anywhere on the screen and have a rectangle appear...well at this stage it would be best for the ArcObjects people to wade in with coding ideas for "on mouse click" event style stuff. There is a world of difference between the static and the dynamic world...good luck
- Mark as New
- Bookmark
- Subscribe
- Mute
- Subscribe to RSS Feed
- Permalink
- Report Inappropriate Content
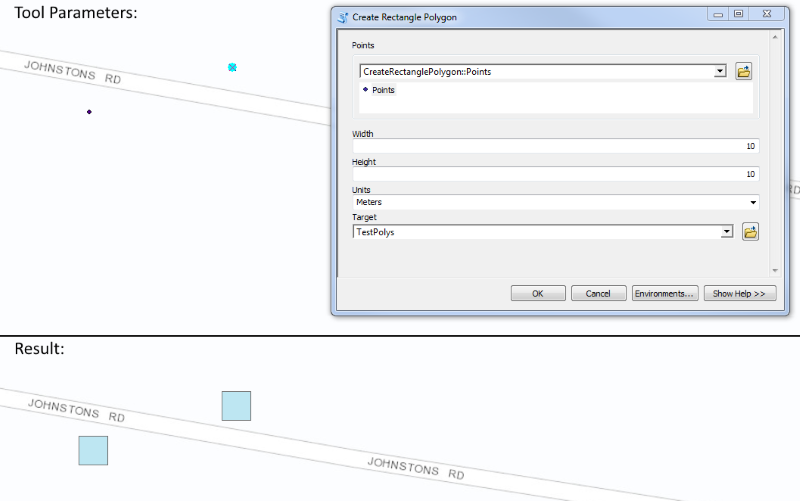
So in-essence, whenever a user clicks the map and has this process active, what would this calculation look like knowing the XY from the mouse click? It is important that the size of the new polygon feature matches the map (size = 10 Feet by 20 Feet). Thoughts?
You can do this using a python script in a custom toolbox.
import arcpy

# Get input parameters - points and target feature class
pts = arcpy.GetParameter(0)
dw = float(arcpy.GetParameterAsText(1))/2
dh = float(arcpy.GetParameterAsText(2))/2
units = arcpy.GetParameterAsText(3)
fc = arcpy.GetParameterAsText(4)

if units == "Feet":
    dw = dw/3.2808399
    dh = dh/3.2808399

# create new polygons from points
cursor = arcpy.da.InsertCursor(fc, ("SHAPE@"))
with arcpy.da.SearchCursor(pts,["SHAPE@XY"]) as newpts:
    for pt in newpts:
        x, y = pt[0]
        # Create polygon geometry from point
        array = arcpy.Array([arcpy.Point(x - dw, y + dh),
                arcpy.Point(x + dw, y + dh),
                arcpy.Point(x + dw, y - dh),
                arcpy.Point(x - dw, y - dh),
                arcpy.Point(x - dw, y + dh)])
        poly = arcpy.Polygon(array)
        cursor.insertRow((poly,))

del cursor
The script takes the following inputs:
- User Defined Points (Feature Set)
- Width (size in units)
- Height (size in units)
- Units (Meters or Feet)
- Target Feature Class (new polygons are created in this)
See this zipped example with toolbox, script and template point feature class (required for feature set parameter).
Note that this example uses the WGS 1984 Web Mercator (auxiliary sphere) projection – so you should use this in your target feature class as well.
Owen
- Mark as New
- Bookmark
- Subscribe
- Mute
- Subscribe to RSS Feed
- Permalink
- Report Inappropriate Content
Forgot to add - this is how it looks in ArcMap:
- Mark as New
- Bookmark
- Subscribe
- Mute
- Subscribe to RSS Feed
- Permalink
- Report Inappropriate Content
Thanks Owen, this is indeed good to know. I may be able to push your script into a geoprocessing service if I can't get Darren's or Filip's code to work like I need it to. I will follow up, thanks