- Home
- :
- All Communities
- :
- Products
- :
- Geoprocessing
- :
- Geoprocessing Questions
- :
- Viewshed from multiple observer points question
- Subscribe to RSS Feed
- Mark Topic as New
- Mark Topic as Read
- Float this Topic for Current User
- Bookmark
- Subscribe
- Mute
- Printer Friendly Page
Viewshed from multiple observer points question
- Mark as New
- Bookmark
- Subscribe
- Mute
- Subscribe to RSS Feed
- Permalink
- Report Inappropriate Content
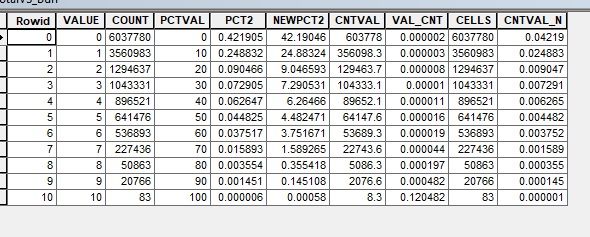
I generated a "total viewshed" of a DEM using a series of random observer points. The resulting viewshed attribute table lists the values as the number of observer observer points visible from a count of pixels with that value. So, if you click on a cell, it will show you how many observer points can see the pixel. However, the attribute table, of course, summarizes this, so every row with a value of, say, 6 is listed with the number of pixels with that value (see 400).
This is fine, but I see a weird issue I can't figure out how to fix, especially when I use a lot of observer points. I see that there are multiple rows with the same count but different numbers of observer points in the value column. In other words, rather than one row in which 500 pixels can be seen from 1 observer location, it will have a series of rows in which, say, 500 pixels can be seen by 1, 501 can be seen by 1, 503 seen by 1, and so on. I assume this is happening because given the large number of points distributed across the landscape these are separate individual cells that can be seen by separate groups of observer points. So the 500 pixels that can be seen by 1 are different pixels than the 501 that can be seen by 1.
My confusion is trying to understand the organization of the data to use in other applications. For example, for larger count values I can easily say something like "20,000 pixels are viewable by x number of sites" since there is only one row. But if I want to say the same thing for 1 site, I have several options. I find this is a challenge also in talking about any cumulative frequencies
- Mark as New
- Bookmark
- Subscribe
- Mute
- Subscribe to RSS Feed
- Permalink
- Report Inappropriate Content
Just as a follow up, would I just add all the count cells that have the same value?
- Mark as New
- Bookmark
- Subscribe
- Mute
- Subscribe to RSS Feed
- Permalink
- Report Inappropriate Content
Hi Chris
which specific viewshed tool are you referring to? (viewshed, visibility, observer points, viewshed 2 - aka geodesic viewshed?)
Please include some screenshots of inputs and outputs, including the attribute tables you're referring to.
Also, which version of esri software are you using?
thanks,
-jt
- Mark as New
- Bookmark
- Subscribe
- Mute
- Subscribe to RSS Feed
- Permalink
- Report Inappropriate Content
Hi Jim,
Thanks for the input. I recently shifted the way I decided to do this, though this issue was never really resolved. I basically made a cumulative viewshed using a distribution of known point locations. I wanted to compare these with a more general viewshed, or a total viewshed. I did this by generating random points throughout and making a viewshed from that. The goal was then to compare the two to see the viewshed for known sites was better (or at least statistically different) than the general "background one." I still think this is a valid approach, with some recognition of assumptions and bias. This is where I was having issue, with the total viewshed from 1000 points.
But in reviewing this and comparable methods, I realized that this is not typically what is done. Most folks will create a broad cumulative viewshed using all known locations and from that VS examine the visibility of sample points against that background. The cumulative viewshed I generated, however, was based only on 10 locations and those were also the only sample I needed. So what I did was use the total viewshed based on 1000 points and then use those data to compare the visibility of the known vs the visibility of a set of fewer random points, 500. I basically extracted the raster data at the point locations for each sample and I did a K-S two sample test on their cumulative distributions.
Nevertheless, I do think that the first approach is valid, comparing a regional (cumulative vs) from known sites with a regional (total) VS made from a ton of randomly distributed sites. It's a different approach, but I think in this case the data I would be comparing would not be the values, which represent visible observer locations, but rather the distribution of visible pixels between them. I think I would have to standardize the raster data since one was generated by 10 points and another by 1000, though I am somewhat confused on this (i.e., do I just divide the count column by 10 in one case and by 1000 in another).
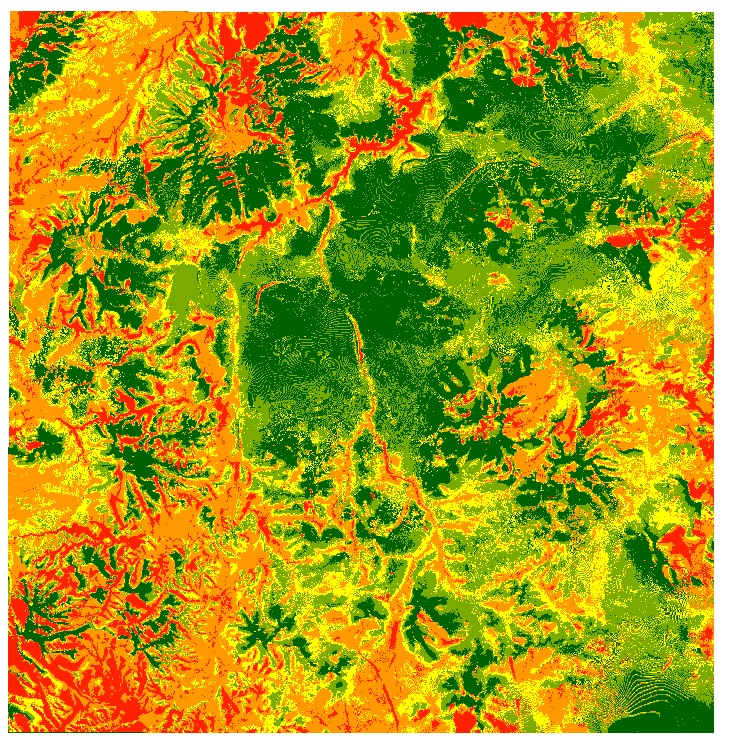
Anyway, to get to your specific questions, I used both the viewshed (not viewshed 2) tool and the visibility tool, which produced the same results for both. I also generated one by creating separate viewsheds for each known site and adding them together in the raster calculator, but that alos produced the same result (I can't easily and efficiently do that with 1000 points, however). I did use the observer tool for a separate examination of the 10 known sites, but there's a limit of 16 input points so I can't do that for the random points. Nevertheless, I am not using that for this issue.
I attached two images of the viewshed rasters. The **bleep** one is from the 10 known points, and the Total one was generated from 1000 random points. I also included screenshots of the attribute tables. Ignore anything other than the value and count columns. The other columns was where I was playing around with standardizing data. In the total attribute screen shot you can see the issue I first described.
- Mark as New
- Bookmark
- Subscribe
- Mute
- Subscribe to RSS Feed
- Permalink
- Report Inappropriate Content
In TotalVS_attribute.jpg, rowid 326 has a value of 326 and a count of 20. This means that there are 20 cells in the output raster each of which can be seen from 326 different observer locations. Each of those 20 cells could have a different set of 326 observer locations.
I see that there are multiple rows with the same count but different numbers of observer points in the value column.
One set of 20 cells could be seen by 10 different observer locations, then a different set of 20 cells could be seen by 5 observer locations, etc. That will produce two rows in the attribute table with values 10 and 5, along with identical counts of 20. Does that help?
Is it the goal of your analysis to identify 10 highly visible sites?
-jt