- Home
- :
- All Communities
- :
- User Groups
- :
- GIS for Geology
- :
- Questions
- :
- Calculating Volume using Cut/Fill Tool
- Subscribe to RSS Feed
- Mark Topic as New
- Mark Topic as Read
- Float this Topic for Current User
- Bookmark
- Subscribe
- Mute
- Printer Friendly Page
Calculating Volume using Cut/Fill Tool
- Mark as New
- Bookmark
- Subscribe
- Mute
- Subscribe to RSS Feed
- Permalink
- Report Inappropriate Content
Hey guys,
I am trying to calculate the volume of a crater using the Cut/Fill Tool. I tried to use the Create Constant Raster to create a top layer to use along the Cut/Fill tool. However, I seem to not get satisfying results.
The available data is an interpolated (natural neighbor) raster of the sample with the crater. The raster is not projected but the scale is known.
Could you guys help figure this one out? I want to first project my raster and set the right scale using the known distances and then calculate the volume of the crater.
Thank you in advance and until then let's keep making the world a happier place
Hasso
- Mark as New
- Bookmark
- Subscribe
- Mute
- Subscribe to RSS Feed
- Permalink
- Report Inappropriate Content
You will need know coordinates for the raster. I am guessing wildly that it was either an raster derived from scanning or one that's spatial reference is lost. You need to know what the cell size represents in ground based units. If you only have a 'scale' as in photo scale or map scale, you will need to know what distance between 2 points is on the raster and the same distance on the ground. You will then get the raster distance in number of cell, to the ground distance, then you convert raster distance into the number of cell between the two points...hence Y distance/X cells = Z distance/cell. Alternately georeferenced the data
If this is not the case...more info needed
- Mark as New
- Bookmark
- Subscribe
- Mute
- Subscribe to RSS Feed
- Permalink
- Report Inappropriate Content
Hello Mr Patterson,
thank you for the quick reply. it is much appreciated.
The data for the raster was actually an ASCII acquired using a white light interferometer and then converted and prepared for ArcGIS using Matlab. Later it was imported to ArcGIS using the tool ASCII to raster. Then this resulting raster is converted to data points using the tool raster to point and finally it the points scatter is interpolated back to raster using natural neighbor.
Therefore these raster aren't geologically referenced. But I know the distance from two points, namely the dimension of the data.
I am still confused how I should go on and tell ArcGIS that this distance from these two points in pixels are this much in µm and set the scale as a result. I thought it would be a simple process to do so just like ImageJ. Is it still necessary to project the data with a geographic dataframe?
Attached is how one of these final raster look like. I apologize that the legend is not included, but the hillshade effect would hopefully make it clear that the green and lighter colored regions form the depression (crater) that I want to calculate its volume using the cut/fill tool. A profile has been drawn across to further explain this.
Thank you in advance and I hope you can assist me further.
Until then let's keep making the world a happier place
Hasso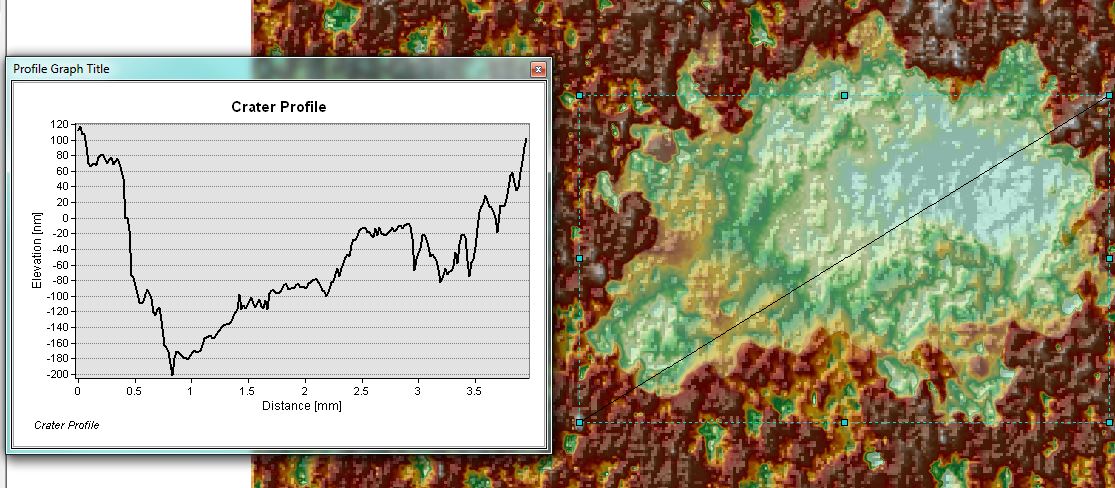
- Mark as New
- Bookmark
- Subscribe
- Mute
- Subscribe to RSS Feed
- Permalink
- Report Inappropriate Content
Well the key bit of information should be available when the data were acquired...what is the area or length covered on the ground. In the ascii file or the imported image you know how many rows and columns there are. You need to use the ground-based dimensions versus the pixel based dimensions. There is no micrometers involved
- Mark as New
- Bookmark
- Subscribe
- Mute
- Subscribe to RSS Feed
- Permalink
- Report Inappropriate Content
Yes the key information is available. (For this example, the length is equal to 7.5 mm and the width is 4.5 mm .
The number of columns is 389 and rows are 250. Cell Size (X= 0.017992832, Y= 0.017992832).
However, my issue is how can I set the scale for ArcGIS so for example the measure tool shows the right units (instead of unknown) and how to project the raster correctly so I can edit shapes and perform geometry calculations like the intended cut/fill tool. Could you give a step by step tutorial on how to this?
Can you please also elaborate on the ground-based dimension versus the pixel based dimension idea? I do not know if I understood correctly since my samples are not "ground-based"?
Thank you
- Mark as New
- Bookmark
- Subscribe
- Mute
- Subscribe to RSS Feed
- Permalink
- Report Inappropriate Content
simply set the data frame units to meters since you are using a non-ground based system. There is no real coordinate system to account for this type of data.
- Mark as New
- Bookmark
- Subscribe
- Mute
- Subscribe to RSS Feed
- Permalink
- Report Inappropriate Content
thank you Mr Patterson. So once I have my units to meters (or millimeters in this case). How can I proceed to calculate the volume of the cavity using the cut/fill tool?