- Home
- :
- All Communities
- :
- Products
- :
- Imagery and Remote Sensing
- :
- Imagery Questions
- :
- Re: Creating Ridgelines/Dam Crests from raster...
- Subscribe to RSS Feed
- Mark Topic as New
- Mark Topic as Read
- Float this Topic for Current User
- Bookmark
- Subscribe
- Mute
- Printer Friendly Page
Creating Ridgelines/Dam Crests from raster...
- Mark as New
- Bookmark
- Subscribe
- Mute
- Subscribe to RSS Feed
- Permalink
- Report Inappropriate Content
Has any one had success creating a ridgeline or earthen dam crest polyline feature class from a raster?
- I am trying to find the crest for 30 earthen dams (for now) from a raster. I tried following trying to make it a stream and analyze it that way (... Extract elevation of ridge crest of a mountain range) but did not have any luck. The aspect spatial analyst tool will "show" where the crest is but still requires some manual editing.
Has anyone found an good workflow to 'extract' the ridge line from a raster?
Thank you!
- Mark as New
- Bookmark
- Subscribe
- Mute
- Subscribe to RSS Feed
- Permalink
- Report Inappropriate Content
Image? to see what you are working with
- Mark as New
- Bookmark
- Subscribe
- Mute
- Subscribe to RSS Feed
- Permalink
- Report Inappropriate Content
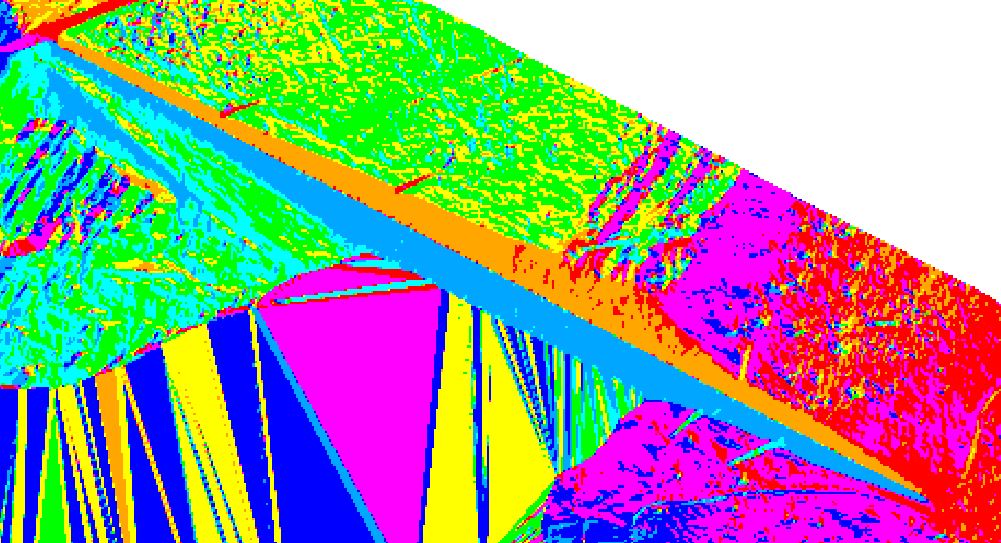
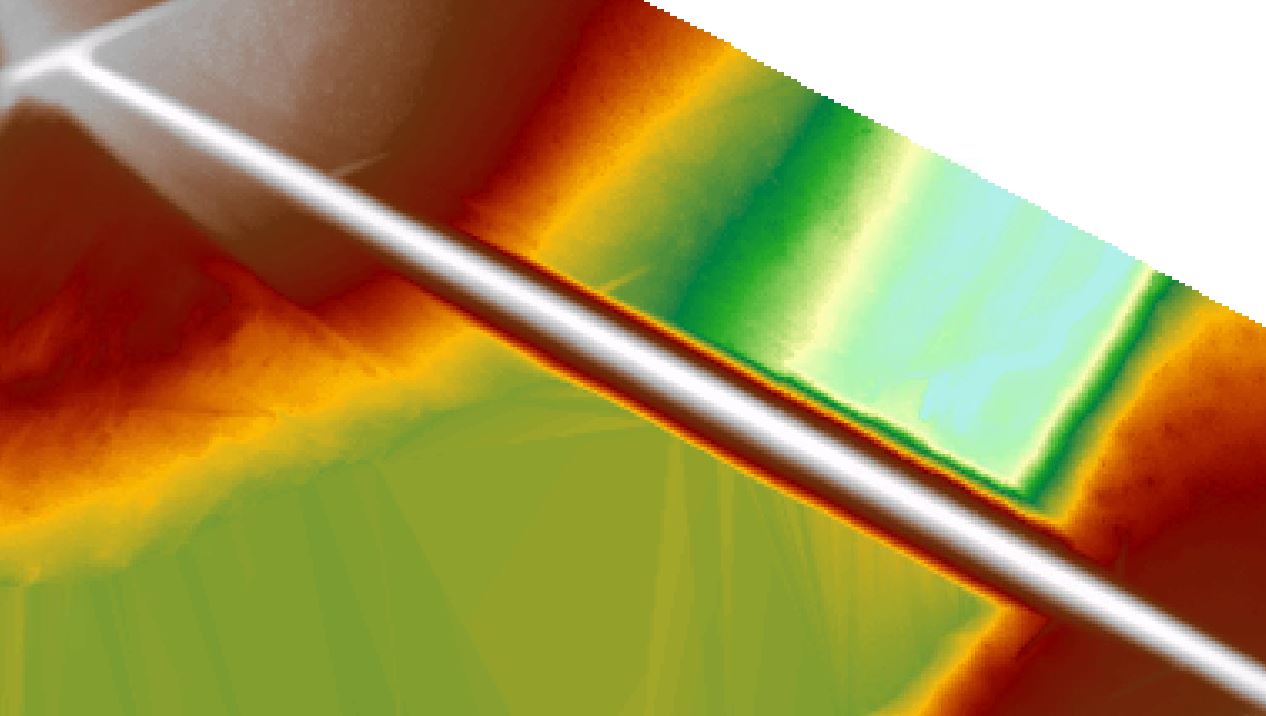
Yes, here is a screen shot of the aspect DEM (1st one below) and the original DEM (2nd below)
In the aspect one, I can zoom in and follow the Blue/Orange divide to manually draw a dam crest line, but was wondering if anyone had any luck doing it a more automated way. Thanks !
- Mark as New
- Bookmark
- Subscribe
- Mute
- Subscribe to RSS Feed
- Permalink
- Report Inappropriate Content
Sorry I didn't get back earlier...the only think I can think of would be to use some zonal window perhaps with a range style option to differentiate those areas where values are significantly different. For example a ridgeline running NS would have one half of the zone (of some extent) with a value of 90ish, whereas the other half would have a value 270ish (going by memory now). If you reclassed the raster using the old school notation
32 64 128
16 x 1 where an 'East' facing slope +/-45 would be classed as 1 etc. I then you can see that the
8 4 2 opposites will have a large range or values in the area where the ridge occurs and zones with similar orientation with have the same value. so I am guessing that a Zonal Statistics with the Range option might give you some semi-automation...from there you could go to thinking about joining discontinuities and thinning the output to lines. Some preliminary thoughts...
- Mark as New
- Bookmark
- Subscribe
- Mute
- Subscribe to RSS Feed
- Permalink
- Report Inappropriate Content
Thanks Dan! I'll give it a try and let you know how it goes.
- Mark as New
- Bookmark
- Subscribe
- Mute
- Subscribe to RSS Feed
- Permalink
- Report Inappropriate Content
Quick thought on a potential reason why things went awry - when you ran the process Extract elevation of ridge crest of a mountain range , did you somehow find a way to keep the reservoir side of the dam from becoming lost in the "Create a Depressionless DEM" part of process? Otherwise I suspect the reservoir may get treated as a Sink and Filled, which would lead to a less visible "ridgeline" when the whole procedure is completed.
Chris Donohue, GISP
- Mark as New
- Bookmark
- Subscribe
- Mute
- Subscribe to RSS Feed
- Permalink
- Report Inappropriate Content
Brian - did you try using the result of the FlowAccumulation tool? The top of your dam (and all other ridges or drainage divides) will have an accumulated flow of zero.
Steve
- Mark as New
- Bookmark
- Subscribe
- Mute
- Subscribe to RSS Feed
- Permalink
- Report Inappropriate Content
Hi Brian, have you tried multiplying your elevation raster by -1, and then performing a flow accumulation on it? Using this method, the streams become ridges, and vice versa.