- Home
- :
- All Communities
- :
- Services
- :
- Implementing ArcGIS
- :
- Implementing ArcGIS Blog
- :
- Capturing Hardware Utilization During an Apache JM...
Capturing Hardware Utilization During an Apache JMeter Load Test (Intermediate)
- Subscribe to RSS Feed
- Mark as New
- Mark as Read
- Bookmark
- Subscribe
- Printer Friendly Page
- Report Inappropriate Content
Capturing Hardware Utilization During an Apache JMeter Load Test
Measured transaction throughput and response times are critical data of any ArcGIS Enterprise load test, but captured hardware utilization of the deployment machines provide vital information as well. Together, these test artifacts allow for the proper analysis of the capabilities and efficiencies of the Site.
Determining that an application or feature service has achieved a particular level of throughput is good, but confirming the scalability characteristics while also examining the captured processor utilization of the tested workload is even better.
This Article will discuss several ways to capture the machine hardware utilization. This resource usage is a great compliment to the results of an Apache JMeter load test of ArcGIS Enterprise and can help further the analysis. The Article will focus on the most common scenarios using free tools and utilities for Windows and Linux.
Capturing Strategies
Unfortunately, there is no one size fits all for capturing hardware utilization in a load test. Given the potential for a multitude of different environments (Windows, Linux, Cloud, Kubernetes, Docker, etc...) or lack of required access and permissions, there may be cases where you will need to alter your strategy and methodology in order to capture and monitor the usage information from your hardware while the Apache JMeter tests run.
For example, perfmon (e.g. Performance Monitor) is free and included with every instance of Microsoft Windows and can work great when all the machines in the environment are on Windows. It is the frontend for several Windows technologies (e.g. WMI, DCOM) and all of them together offer a versatile framework for monitoring hardware utilization in "real-time" with graphs or scripting a resource capture to a data file.
However, perfmon is not available for Linux so another tool (e.g. dstat) would be needed to capture the equivalent information. Of course, even with an all Windows setup, challenges can still arise with the perfmon approach, such as with restrictive cloud environments. But, are there any other ways to record this valuable machine data? We'll explore the answer to that question later in this Article.
What Information Should the Load Test Capture?
When GIS work such as generating a map image or calculating a Geoprocessing service request is sent to an ArcGIS Enterprise deployment, the server machines that work on the response will utilize various hardware resources to complete the job. Ideally, most of the work happens in the central processor unit (CPU) but this is not always the case.
Regardless of the technology used to monitor and capturing usage for your load test, there are four primary hardware counter categories that all server machines have:
- Processor
- Memory
- Network
- Disk
Each category has a variety of metrics that can be used for the showing utilization of that resource. Its not necessary (or recommended) to capture every available processor metric during a test...just the vital ones. In other words, the ones needed to answer typical load test questions or the particular story you are after.
Typically, some important metrics include the following:
- Processor
- Utilization percentage
- Memory
- Available (MB or bytes)
- Used (MB or bytes)
- Used percentage
- Network
- Send (MB or bytes)
- Received (MB or bytes)
- Disk
- Idle percentage
- Queue length
- Read (MB or bytes)
- Write (MB or bytes)
Note: If your servers have multiple disks, it is highly recommend to collect on all of them but separately. In other words, treat the C drive, D drive and E drive as different resources when capturing using. It technically possible to have multiple active Network devices but it is not very common.
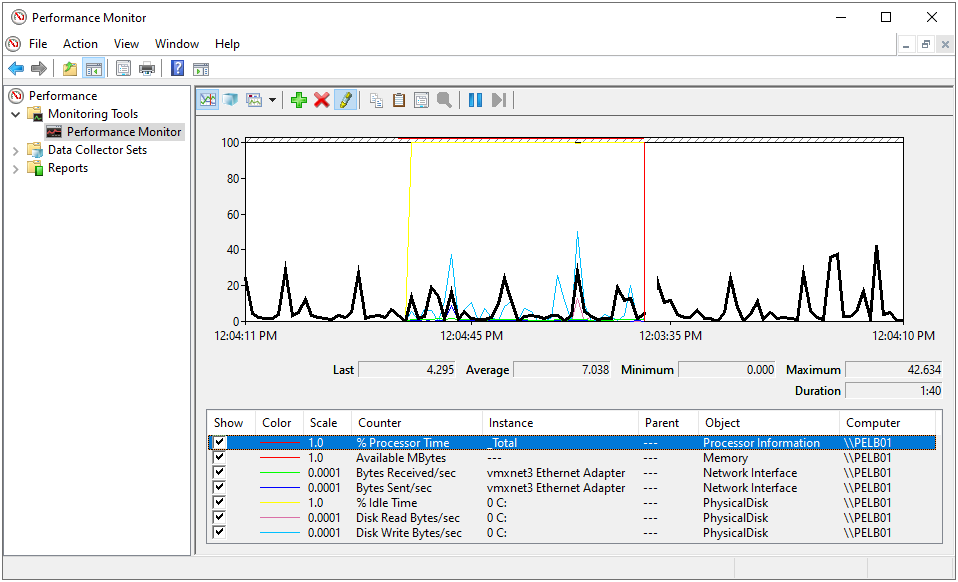
- The Performance Monitor interface collecting from various hardware metrics that have been added manually added (to perfmon):
Note: Some methodologies for capturing the utilization will save the values in bytes or while other use megabytes. Either is fine, but it is important to understand which one is being captured for analysis and report presentation of the data.
Note: Together with the transaction throughput (e.g. transactions/sec) and transaction response times (e.g. seconds), the metrics listed above make up the bulk of a load test's Key Performance Indicators (KPIs). KPIs help evaluate and benchmark the success of a particular test or effort against defined test goals (e.g. the Test Plan).
Sample Interval
Typically, a load test (with a primary focus on scalability) does not run more than an hour or two. Since that is considered a relatively short duration, it makes sense to capture the hardware utilization with a fast interval (e.g. short frequency) of 5 to 10 seconds. This helps ensure that enough data is obtained for performing a thorough analysis. If the capture interval is 1 minute or longer, some significant impacts to the hardware resources (from the test) might be missed.
Note: Monitoring software may already be running on your network that is periodically collecting hardware utilization from your ArcGIS Enterprise servers. If any generated reports are available, they can be used for load test analysis as long as the capture interval is on a short frequency (e.g. 5 to 10 seconds). For load test analysis, you are interested in good metric detail for a few hours as opposed to broad metric coverage of a full day.
The Difference Between Capturing and Monitoring
The terms "capturing" and "monitoring" hardware utilization are often used interchangeably. However, for Apache JMeter testing purposes, this Article is focused on capturing the usage over monitoring it. The key difference here is the capturing means we are recording or saving the information for easier post-test analysis.
Test Clients (Load Generator Machines)
When capturing hardware utilization from a load test against ArcGIS Enterprise, it is a best testing practice to also measure usage from the Test Client machine(s).
Understandably, most of the focus is put into observing the server resources, but the hardware from the test clients can be a bottleneck too. If these machines do not have enough capacity (e.g. processor, memory, network or disk) the ability to generate load against your deployment will be negatively impacted!
Understand Your Server Baselines
If you are not very familiar with the hardware of your ArcGIS Enterprise deployment, it is recommended to watch the resource utilization while the system is idle. This "usage" will help paint a mental picture of the best case scenario. In other words, what does the machine look like when the software and services are running but no one is using it. In such a scenario, resource activity from all four hardware categories should be minimal.
A load tests does not need to record this information of the "idle state" but it is good to be aware of what it looks like.
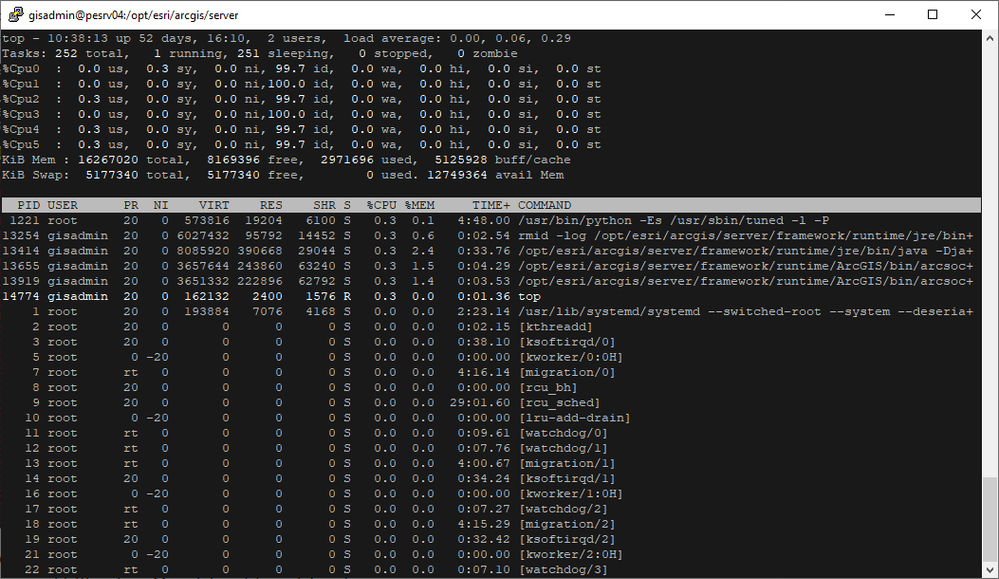
Note: Using tools like Task Manager (for Windows) or top (for Linux) are great tools for manually getting a quick view of system resource utilization. However, these are not ideal saving the usage from all the categories to a file.
- Task Manager's view of system resource utilization (Windows):
- top's view of system resource utilization (Linux):
Common Utilization Capturing Examples
Using Perfmon (To Capture Utilization Outside of Load Test)
Assuming the required permissions are available for your user account in Windows, perfmon is one of the easiest ways to record hardware utilization for load testing analysis. Performance Monitor (and the supporting technologies) can capture the usage from the local machine or multiple remote servers, simultaneously.
Note: As a reminder, the metrics available to perfmon within each hardware group are plentiful.
There is also a large amount of software metrics that can be captured. But in this case, less is more. Only a small handful of counters are needed for most situations.
As mentioned earlier, where you can run into considerations:
- The ArcGIS Enterprise deployment is running on Linux
- perfmon is not available for Linux
- The easiest workaround is to use another methodology to collect the information (discussed later)
- perfmon is not available for Linux
- The deployment is in the cloud
- Running erfmon in the cloud to collect from other deployment machines (in the cloud) is technically possible but behind-the-scenes it uses networking protocols that are typically blocked in the environment
- The easiest workaround here is to run perfmon manually on each cloud machine and collect the generated outputs when the test has completed
- Running erfmon in the cloud to collect from other deployment machines (in the cloud) is technically possible but behind-the-scenes it uses networking protocols that are typically blocked in the environment
Launching perfmon in Windows is as simple as executing:
- Run --> perfmon
From there you can add each machine as well as each respective hardware metric and counter. While this is very powerful, it can be time consuming and potentially prone to typos!
Instead, the recommended strategy for this methodology is to use a PowerShell script where all of these items are predefined.
- The following will gather key perfmon metrics (that are already defined) from the four primary hardware categories and will do this for four different machines (that you can specify):
# ==============================================================================
# Updated:      2022-08-02
# Filename:     ps_get_all_continuous.ps1
# Version:      0.1.0
# Desc:         Continuously collect various metrics and save (binary) values to a file
# Notes:        It is recommended to start the metric collection 20 seconds before test starts
#               as counter initialization can take some time
# ==============================================================================


Write-Output -InputObject 'Collecting all metrics (continuous)...'


# Variables
# Windows Perfmon Counter(s)
$counters = "Processor(_Total)\% Processor Time","Memory\Available MBytes","Memory\Committed Bytes","Memory\% Committed Bytes In Use","Network Interface(*)\Bytes Received/sec","Network Interface(*)\Bytes Sent/sec","LogicalDisk(_Total)\% Idle Time","LogicalDisk(_Total)\Disk Read Bytes/sec","LogicalDisk(_Total)\Disk Write Bytes/sec"
# Machines to collect from
$computers = @('server1.domain.com','server2.domain.com','server3.domain.com','server4.domain.com')
# Time in seconds between each sample collection
$sampleinterval = 10
$date = (Get-Date)
$dyndate = '{0:yyyyMMddTHHmmss}' -f $date # 20220303T140044
# File name
$filename = "perfmon_all_continuous"
# Output file type (choices are blg, csv, or tsv)
$outputfiletype = "blg"
# Output file
$outputfile = '{0}_{1}.{2}' -f $filename, $dyndate, $outputfiletype


# Get-counter
Write-Output -InputObject ('Start DateTime: {0}' -f $date)
Get-counter -Computername $computers -Counter $counters -Continuous -Sampleinterval $sampleinterval | Export-counter -Force -FileFormat $outputfiletype -Path $outputfile
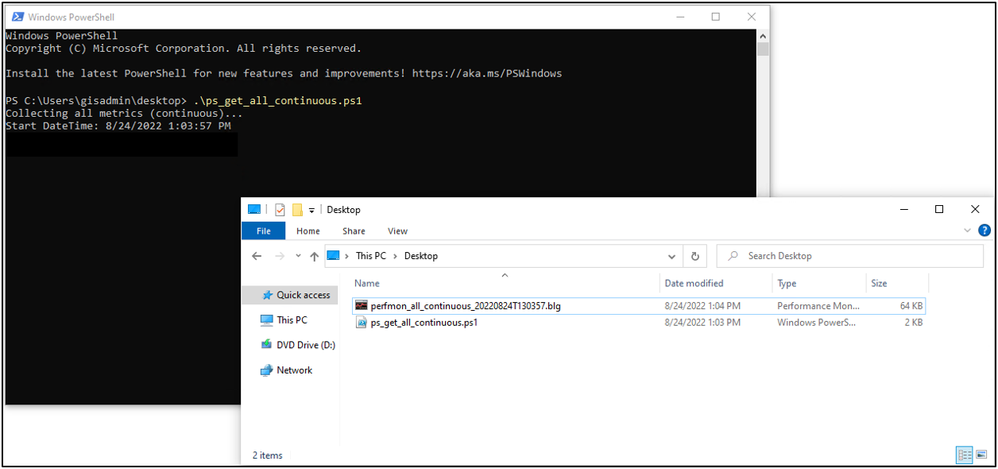
- The metrics are collected every 10 seconds until you hit Ctrl-C in the PowerShell window. The information is saved in a binary formatted file that you can open in Windows (for further analysis or transformation):
Note: It is recommended to start this Powershell script about 20 or 30 seconds before your start the load test as counter initialization is not immediate and takes a moment or two.
- You can open the *.blg file at any time during the capture, but the latest information is not flushed and saved to the file until you hit Ctrl-C from the PowerShell window where the script is running.
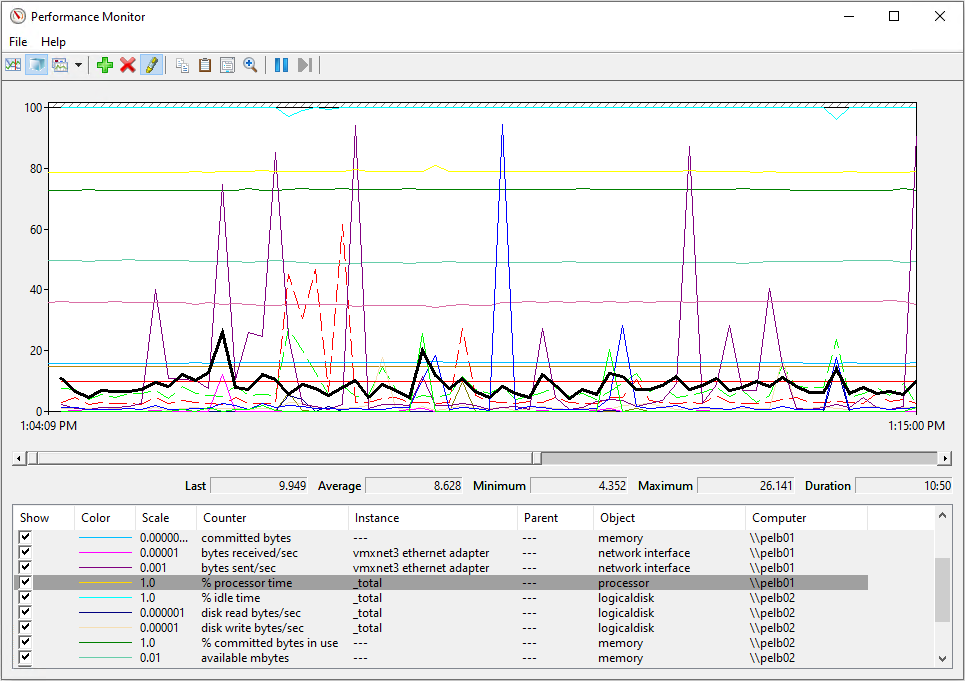
- Double-clicking and opening the *.blg file should look similar to the following:
The end result is an output that looks very similar to what we captured. However, in this case, the process has been automated (which is a good thing).
From this interface in Performance Monitor, you can select/deselect metrics for specific isolation, export the graph as an image, save the raw data to another format like CSV, or conduct usage analysis from all of the collected machines. Pretty powerful!
Note: Performance Monitor scripts do not directly integrate into JMeter.
Note: For cloud deployments, you may have to run the perfmon script on each respective server manually.
Using dstat (To Capture Utilization Outside of Load Test)
dstat is a free command line tool (written by dag@wieers.com) available for (or with) most Linux distributions that captures (and monitors) hardware utilization.
Although the utility has not been updated for several years, it is fairly robust and easy to script.
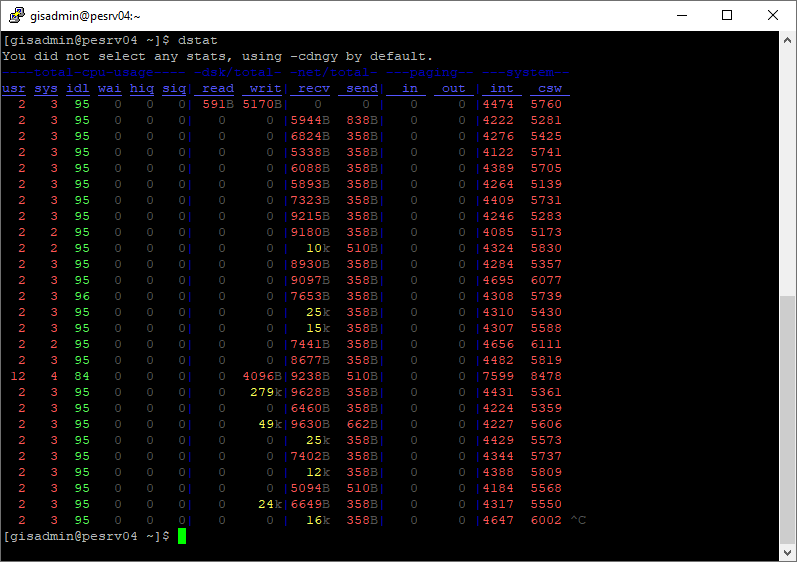
- dstat terminal output with running it with no options:
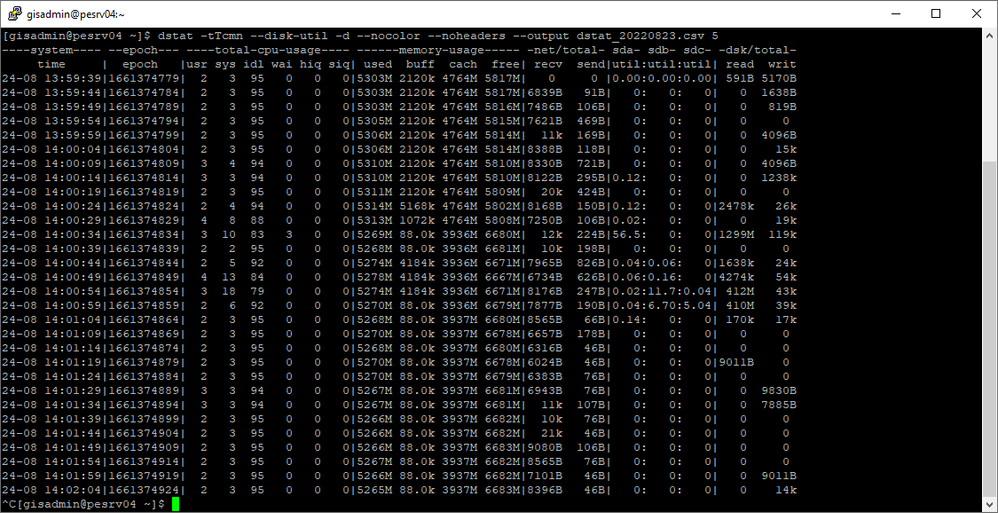
The following will run on your Linux server and capture hardware usage to a csv file every 5 second until you manually stop it with Ctrl-C:
- [gisadmin@pesrv04 ~]$ dstat -tTcmn --disk-util -d --nocolor --noheaders --output dstat_20220823.csv 5
Note: With dstat, the captured processor usage is "idle time percentage", not usage percentage. To get the usage percentage, subtract 100 from the value . However, the disk utilization is in a usage percentage. Additionally, the output above includes a presentation format so the raw values (not shown) for memory, network and disk are saved as bytes.
Note: dstat scripts would need to be run manually and separately on every Linux machine in the deployment. They do not directly integrate into JMeter. Once a load test is done and the scripts stopped, the CSV files can be collected and analyzed (e.g. plotted or charted in a spreadsheet program).
Using Apache JMeter (To Capture Utilization Directly From Load Test)
Although it has a few more steps (as well as its own hurdles) than perfmon and dstat scripts, using Apache JMeter to capture hardware utilization has one main advantage:
- Consistency. The same JMeter Test Plan can be used to capture the same hardware metrics from Windows and Linux (and Mac)
- This is accomplished through several free pieces of software:
- The jp@gc - PerfMon Metrics Collector extension that is added to JMeter
- This component is used to define what metrics to collect and from which machines
- The PerfMon Server Agent tool that runs in a Java Runtime Environment (JRE) on each server in the deployment
- This component does the actual collection on each server and sends the data back to the JMeter
- The jp@gc - PerfMon Metrics Collector extension that is added to JMeter
- This is accomplished through several free pieces of software:
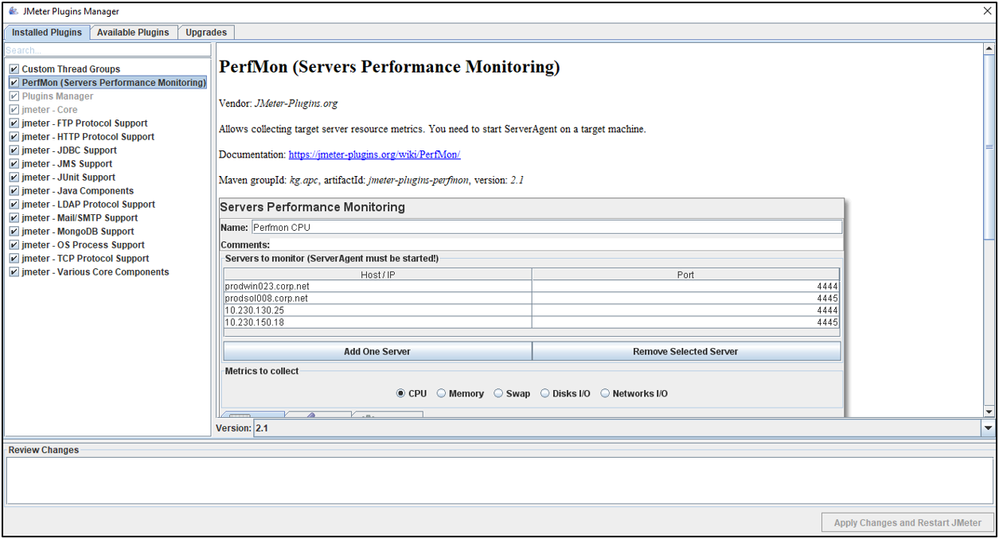
The jp@gc - PerfMon Metrics Collector component can be easily added to the Test Plan through the JMeter Plugins Manager (found under "PerfMon (Servers Performance Monitoring):
The PerfMon Server Agent component is relatively easy to add but a few extra steps to get it to work right.
Note: Due to a bug in the sigar-amd64-winnt library, the ServerAgent crashes if you use the out-of-the-box library with the JDK or JRE greater than version 8. The workaround is to patch the library or use an up-to-date version 8 JRE.
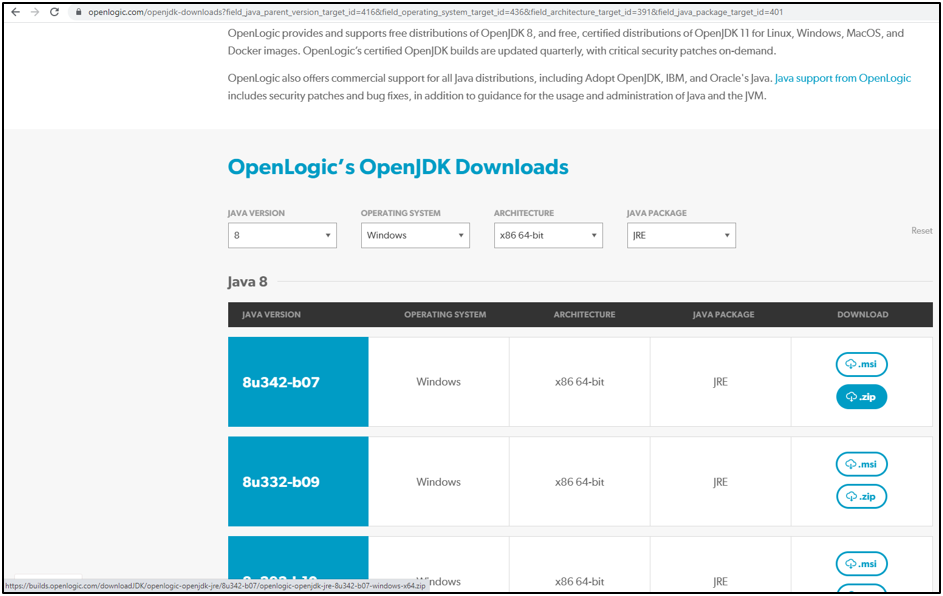
OpenLogic provides free, periodically updated v8 OpenJDK (and JRE) releases to download for Windows, Linux and Mac. Although the JDK would work, the JRE is recommended in this case as it is a smaller package to download but still provides the environment needed for the agent to run.
Note: Either the 32bit or 64bit JRE will work for the ServerAgent.
Note: The OpenLogic JDK or JRE can also be used to run Apache JMeter itself.
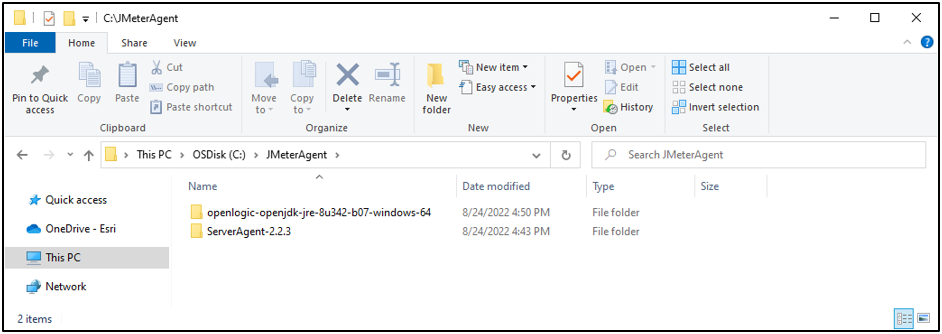
- The ServerAgent and OpenLogic JRE unzipped in the same folder:
- The OpenLogic JRE moved into the ServerAgent folder:
- Open the startAgent.bat file in an editor and update it with the name of the JRE directory that was copied into the ServerAgent folder:
 off

set JAVAPATH=.\openlogic-openjdk-jre-8u342-b07-windows-64\bin
%JAVAPATH%\java -jar %0\..\CMDRunner.jar --tool PerfMonAgent %*
- Save the changes
- The C:\JMeterAgent\ServerAgent-2.2.3 folder now has a self-contained ServerAgent that can be copied over to the appropriate machines for collecting their hardware utilization
- To start the agent in Windows, double-click on the startAgent.bat
- The agent will launch into a command window:
- The agent will not start "collecting" metrics until directed by the Apache JMeter Test Plan
- By default, the agent and JMeter will communicate with each other on TCP and UDP port 4444
Note: The jp@gc - PerfMon Metrics Collector uses the name "perfmon" but does not actually utilize Windows Performance Monitor technology.
The SampleWorldCities Test Plan With Metric Collection Support
- To download the Apache JMeter Test Plan used in this Article see: sampleworldcities5.zip
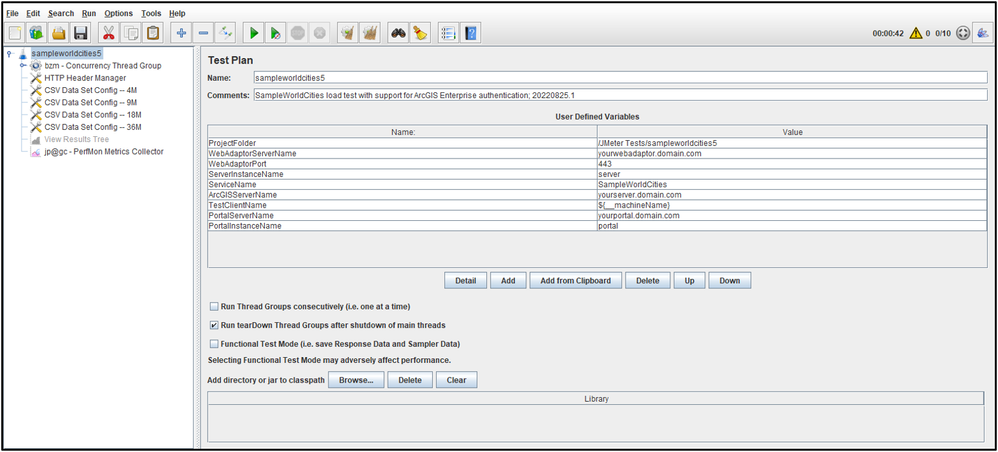
- Opening the Test Plan in Apache JMeter should look similar to the following:
- Adjust the User Defined Variables to fit your environment
- This test defines four different machines to collect hardware utilization from:
- A web adaptor
- The requests are also sent to this endpoint
- An ArcGIS Server
- A Portal for ArcGIS
- The Test Client (the machine running JMeter)
- The hostname of this machine is auto-detected by JMeter when the test runs
- A web adaptor
- This test defines four different machines to collect hardware utilization from:
- Adjust the User Defined Variables to fit your environment
Components of the Test Plan
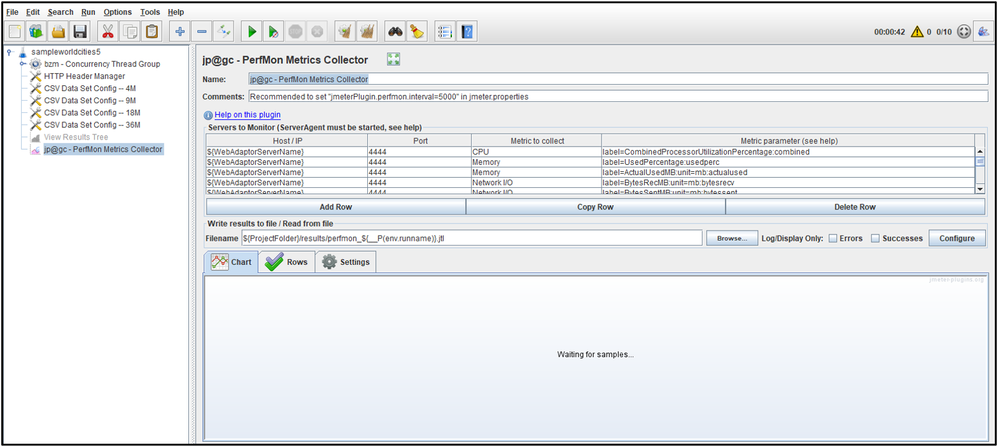
The jp@gc - PerfMon Metrics Collector extension is the only element of interest here as this test is practically identical to previous Article Test Plans for SampleWorldCities.
jp@gc - PerfMon Metrics Collector Extension
As mentioned earlier, the extension is what tells each running agent what it want them to collect. The Test Plan available in this Article has already added the counters for each of the four primary hardware categories.
Note: The metrics parameters will work for Linux and Mac. However, the Disks IO metrics are in the extension are configured to collect on the C drive (e.g. C\:\) which does not exist in Linux. This would need to be changed to /.
Validate the JMeter-to-ServerAgent Connectivity
Start the test from the GUI by click the play button (green triangle)
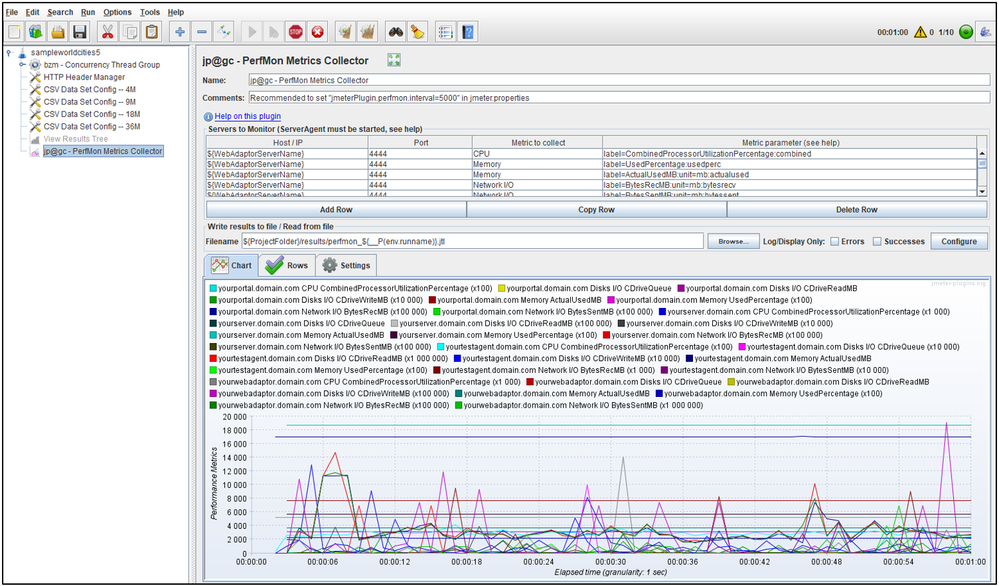
- If all the ServerAgents are running and reachable on all the intended machines in the ArcGIS Enterprise deployment, they should be able to collect utilization and send the information back to the Test Plan
- As JMeter receives this information it will display the information in the Chart tab
- Let this collect for a few second to validate connectivity then stop the test
Note: When the test is run from the command line, the Filename containing the data of the collected metrics will be based on variables in the bat script that define the "results_" file. Once the test has completed, you can use this "jp@gc - PerfMon Metrics Collector" element to load the raw values and either isolate particular counters or generate chart images. This file will start with the string "perfmon_". The results and perfmon files both end with a *.jtl extension but are just CSV files.
Test Execution
The load test should be run in the same manner as a typical JMeter Test Plan.
See the runMe_withP.bat script included with the sampleworldcities5.zip project for an example on how to run a test as recommended by the Apache JMeter team.
- The runMe_withP.bat script contains a jmeterbin variable that will need to be set to the appropriate value for your environment
- This script contains a little more logic than the runMe.bat found in other Test Plan Articles
- This extra logic was added so the results file and the file containing the collected hardware end with the same runname
- Contents of the runMe_withP.bat script:
echo off
rem Scripted JMeter Test Plan execution
rem Utilizing ApacheJMeter.jar for invocation
rem
rem 2022/08/25.1
rem
rem With environment variable to JMeter support (for PerfMon extension)


rem ~~~~~~~~~~~~~~~~~~~~~~~~~~~~~~~~~~~~~~~~~~~~~~~~~~~~~~~~~~~~~~~~~~~~~~~~~~~
rem *** Variables ***

rem Set JMeter memory to min/max of 4GB (adjust based on your test client resources)
set heap=-Xms4g -Xmx4g -XX:MaxMetaspaceSize=256m

rem Location of %JAVA_HOME%\bin
set javadir=%JAVA_HOME%\bin

rem Location of Apache JMeter bin
set jmeterbin=C:\apache-jmeter-5.5\bin

rem Location of JMeter Test Plan root folder (e.g. the folder where the Test Plan resides)
set projectdir=%~dp0

rem Name of the JMeter Test Plan (without the JMX file extension)
set testname=sampleworldcities5

rem String appended to results file of each test run
set runname=testrun1

rem Proxy settings
rem set proxyhost=http://localhost
rem set proxyport=8888
rem ~~~~~~~~~~~~~~~~~~~~~~~~~~~~~~~~~~~~~~~~~~~~~~~~~~~~~~~~~~~~~~~~~~~~~~~~~~~


rem *** Start your engines ***
color 20

rem Set environment variable to reference in test (e.g. ${__P(env.run)})
set jvm_args="-Denv.runname=%testname%_%runname%"

echo on
rem *** Test started ***
%javadir%\java.exe --illegal-access=warn %jvm_args% %heap% -jar %jmeterbin%\ApacheJMeter.jar -Jjmeter.save.saveservice.autoflush=false -n -f -t "%projectdir%\%testname%.jmx" ^
-l "%projectdir%\results\results_%testname%_%runname%.jtl" ^
-j "%projectdir%\logs\debug_%testname%_%runname%.log" ^
-e -o "%projectdir%\reports\%testname%_%runname%" ^
rem uncomment as needed
rem -H %proxyhost% -P %proxyport% ^
rem *** Test completed ***
echo off


color 40
ping localhost -n 5
color 07
Note: It is always recommended to coordinate the load test start time and duration with the appropriate personnel of your organization. This ensures minimal impact to users and other colleagues that may also need to use your on-premise ArcGIS Enterprise Site. Additionally, this helps prevent system noise from other activity and use which may "pollute" the test results.
Note: For several reasons, it is strongly advised to never load test services provided by ArcGIS Online.
General Methodology Guide
This guide is not intended to be comprehensive covering every hardware utilization capture scenario.
- Scenario #1
- Servers
- Windows
- Environment
- On-premise
- Collecting Machine (Test Client)
- Windows
- Description
- Capturing Windows usage from Windows
- Difficulty
- Easy/Moderate
- Recommended Methodology
- Windows Perfmon (via PowerShell script)
- Servers
- Scenario #2
- Servers
- Windows/Linux
- Environment
- On-premise
- Collecting Machine (Test Client)
- Windows
- Description
- Capturing Windows/Linux usage from Windows
- Difficulty
- Moderate
- Recommended Methodology
- JMeter Perfmon Extension and ServerAgent
- Servers
- Scenario #3
- Servers
- Linux
- Environment
- On-premise
- Collecting Machine (Test Client)
- Windows/Linux
- Description
- Capturing Linux usage from Windows/Linux
- Difficulty
- Easy/Moderate
- Recommended Methodology
- dstat command or script
- Servers
- Scenario #4
- Servers
- Windows/Linux
- Environment
- Cloud
- Collecting Machine (Test Client)
- Windows
- Description
- Capturing Windows/Linux usage from Windows
- Difficulty
- Moderate
- Recommended Methodology
- Cloud Watch/Azure Monitor (not covered in this Article)
- Servers
- Scenario #5
- Servers
- Windows
- Environment
- Cloud
- Collecting Machine (Test Client)
- Windows
- Description
- Capturing Windows usage from Windows
- Difficulty
- Moderate
- Recommended Methodology
- Run Windows Perfmon (via PowerShell script) on each machine in the deployment
- Servers
- Scenario #6
- Servers
- Linux
- Environment
- Kubernetes
- Collecting Machine (Test Client)
- Windows
- Description
- Capturing Linux contain/pod usage from Windows
- Difficulty
- Moderate/Hard
- Recommended Methodology
- Environment dashboard or custom resource endpoint (not covered in this Article)
- Servers
Common Utilization Collection Challenges
Capturing hardware utilization of deployment machines for a load test is a best testing practice but it is not always possible.
The most typical challenges are:
- Permissions
- The most common
- Not having been granted access to or the ability to capture usage from remote servers is the most common challenge
- Environment/Location
- Collecting utilization from machines on the local network is one thing, collecting usage from machines in the cloud is another thing
- Operation System
- Sometimes the OS presents its own *hurdles* for capturing the utilization
- Technical
- Certain environments (e.g. Kubernetes/Docker) may not have the same APIs for collecting the usage as a traditional (physical or virtual) machine
Final Thoughts
Simply put, there are many ways to capture hardware utilization information from the machines in an ArcGIS Enterprise deployment to analyze with your load test results. Which is the best way to capture it...any way that works best were you can quickly record the info and use it for effectively analysis.
Although no one Article can cover every situation, environment and scenario, this one lists several methodologies for capturing this data for common ones.
You must be a registered user to add a comment. If you've already registered, sign in. Otherwise, register and sign in.
