- Home
- :
- All Communities
- :
- Products
- :
- Mapping
- :
- Mapping Questions
- :
- Re: Are overlapping polygons an acceptable means o...
- Subscribe to RSS Feed
- Mark Topic as New
- Mark Topic as Read
- Float this Topic for Current User
- Bookmark
- Subscribe
- Mute
- Printer Friendly Page
Are overlapping polygons an acceptable means of displaying archive data?
- Mark as New
- Bookmark
- Subscribe
- Mute
- Subscribe to RSS Feed
- Permalink
- Report Inappropriate Content
I've inherited a feature class that has overlapping polygons that show land uses of previous years. The polygons have different shapes and there can be up to six polygons on top of each other. It seems like an easy way for users to click identify in an area and see all of the old data, but is this bad form? The intended destination is AGOL. Are there other alternatives for displaying archive data of a same location?
Thanks, Scott
Solved! Go to Solution.
Accepted Solutions
- Mark as New
- Bookmark
- Subscribe
- Mute
- Subscribe to RSS Feed
- Permalink
- Report Inappropriate Content
It depends. Some issues that may come up:
1. Are they differentiated by a year attribute? How will the user tell the the polygons apart?
2. The order the overlapping polygons were drawn can affect whether they are visible at first glance. For example, if a small polygon is overlaid by a larger polygon and a fill is used, a viewer may not even realize it is there as they won't see it. This is because the draw order is affected by the order the polygons were drawn (not by attributes like years).
Chris Donohue, GISP
- Mark as New
- Bookmark
- Subscribe
- Mute
- Subscribe to RSS Feed
- Permalink
- Report Inappropriate Content
I have seen this before. I think it's acceptable as long as it's made perfectly clear that these are overlapping polygons, because that is not the usual way to treat polygons. It can be extremely annoying to find out that there were overlapping polygons, after you've done any sort of processing (area summaries, for example).
edit: it really depends on how you want to use the polygons. If overlapping polygons work for your application, great. If not, try something else (symbology, flatten the whole structure, etc.).
- Mark as New
- Bookmark
- Subscribe
- Mute
- Subscribe to RSS Feed
- Permalink
- Report Inappropriate Content
It depends. Some issues that may come up:
1. Are they differentiated by a year attribute? How will the user tell the the polygons apart?
2. The order the overlapping polygons were drawn can affect whether they are visible at first glance. For example, if a small polygon is overlaid by a larger polygon and a fill is used, a viewer may not even realize it is there as they won't see it. This is because the draw order is affected by the order the polygons were drawn (not by attributes like years).
Chris Donohue, GISP
- Mark as New
- Bookmark
- Subscribe
- Mute
- Subscribe to RSS Feed
- Permalink
- Report Inappropriate Content
Here's a quick example of the visibility/symbology issues that can come up with overlapping polygons:
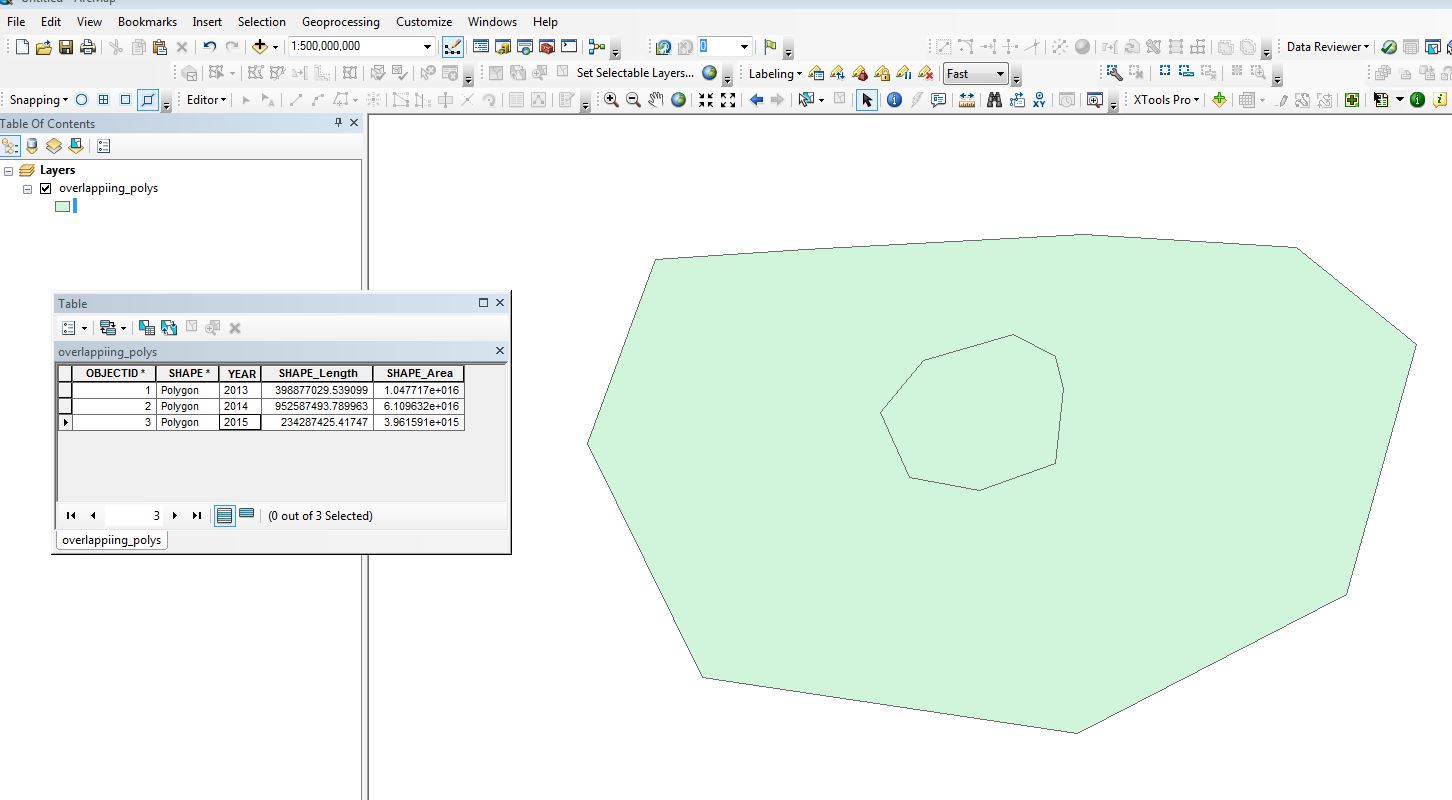
1. 3 polygons were digitized. This is what is visible when it is just simple fill. Note only 2 of the 3 polygons are visible. A viewer would not even realize that there is another polygon here.
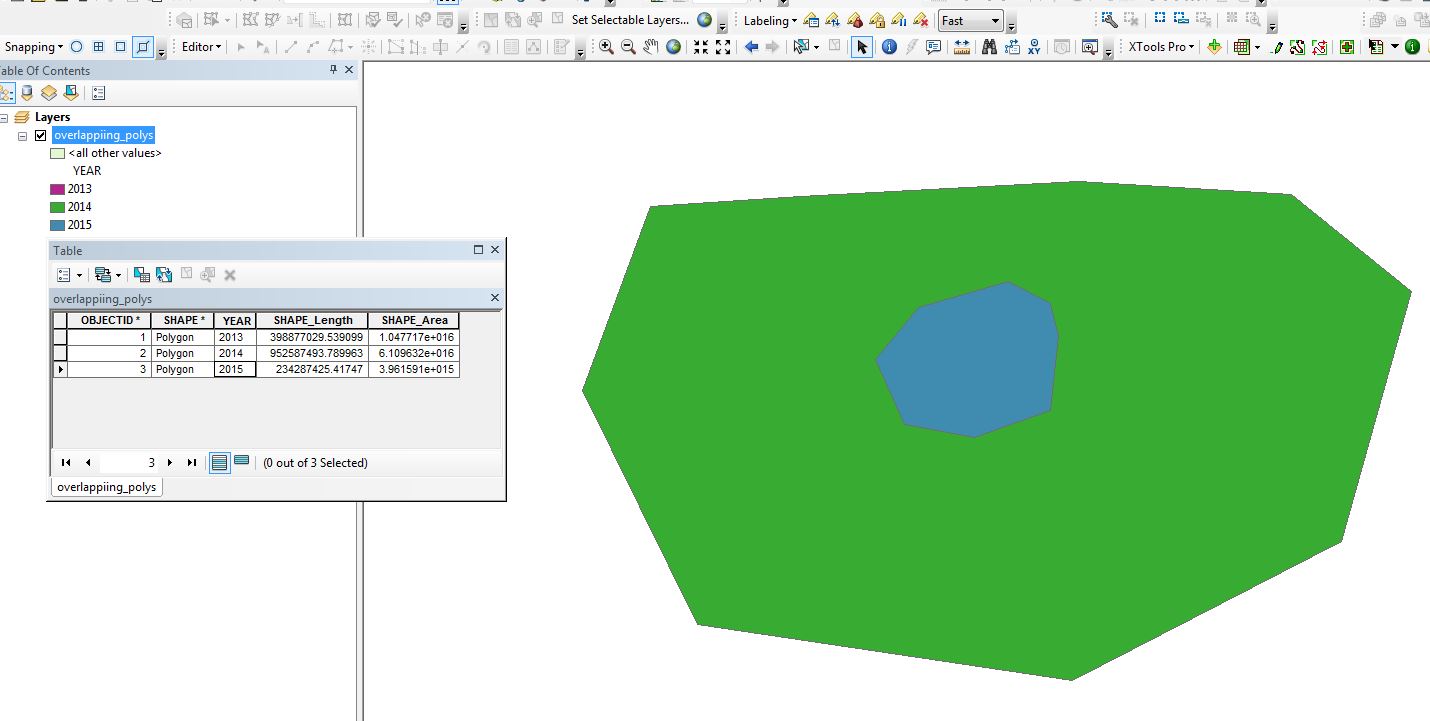
2. Breaking out the polygons by a year using fill symbology looks better, but still can only see two of the three polygons. Note also that the "missing" polygon is the one that was drawn first and the 2015 polygon (blue) was drawn last, thus the 2015 is on top of the green polygon.
3. Symbolization with a hollow fill. 3 polygons visible, but the linework can can potentially confuse a viewer as to the extent of each poly unless you color code the linework or use other cartographic methods. I labelled the year here, but as you can see that is not the best way to go to help the viewer figure out which extent is which. Definitely potential for confusion.

Usually folks avoid using overlapping polygons, as they can cause issues like this. Also, as Darren Wiens mentioned the overlapping can cause major headaches when one does geoprocessing on the layer if the user is not aware that they polys are overlapping and does not adjust for that.
Now, that said, I have seen some folks who do use overlapping polygons. The two topics that come to mind are Fire and Plant/Animal specie datasets. For example, I've seen Fire datasets of polygons for many years of burned-area in one poly layer for Fire. For Plants, sources like the California Natural Diversity Database (CNDDB), which have years and years of polys for Sensitive Species overlapping each other California Natural Diversity Database Home .
So ultimately it comes down to what you want to do with it, realizing that going forward with overlapping polygons has several potential issues, which will require some consideration and maybe some tradeoffs.
Chris Donohue, GISP
- Mark as New
- Bookmark
- Subscribe
- Mute
- Subscribe to RSS Feed
- Permalink
- Report Inappropriate Content
Thank you Darren and Chris for your input. There's no decision yet of which way we'll go, with overlaps or no overlaps. Scott