- Home
- :
- All Communities
- :
- Products
- :
- Mapping
- :
- Mapping Questions
- :
- Re: Draw tools don't work in Data view
- Subscribe to RSS Feed
- Mark Topic as New
- Mark Topic as Read
- Float this Topic for Current User
- Bookmark
- Subscribe
- Mute
- Printer Friendly Page
- Mark as New
- Bookmark
- Subscribe
- Mute
- Subscribe to RSS Feed
- Permalink
- Report Inappropriate Content
My 'Draw' toolbar won't work in Data view. The tools appear to work, but are invisible when they actually draw and I can't select and access the properties. Any suggestions on how to fix? They do however, work in Layout view...Thanks!
Solved! Go to Solution.
Accepted Solutions
- Mark as New
- Bookmark
- Subscribe
- Mute
- Subscribe to RSS Feed
- Permalink
- Report Inappropriate Content
Also, check to make sure the data frame's "target" annotation group is set to be visible. To do this, open the Data Frame properties, Annotation Groups tab and make sure the checkbox next to the annotation group name is checked on.
You can check to see which Annotation Group is the target for drawing by going to the Draw toolbar, Drawing menu, Active Annotation Target pullright.
- Mark as New
- Bookmark
- Subscribe
- Mute
- Subscribe to RSS Feed
- Permalink
- Report Inappropriate Content
Do they work in a new mxd? If not, does it help to reset your Normal.mxt (see bottom of this page)?
- Mark as New
- Bookmark
- Subscribe
- Mute
- Subscribe to RSS Feed
- Permalink
- Report Inappropriate Content
No they don't work in new map. I gave your suggestion a try - renamed normal.mxt and restarted - same problem  .
.
- Mark as New
- Bookmark
- Subscribe
- Mute
- Subscribe to RSS Feed
- Permalink
- Report Inappropriate Content
This might help, might not, try creating a new annotation group or ensuring that yours is turned on, the active annotation target, and/or set to the right scale:
- Mark as New
- Bookmark
- Subscribe
- Mute
- Subscribe to RSS Feed
- Permalink
- Report Inappropriate Content
Thanks Michael - your suggestion was the right one!
- Mark as New
- Bookmark
- Subscribe
- Mute
- Subscribe to RSS Feed
- Permalink
- Report Inappropriate Content
Might have something to do with the coordinate system. The graphic draw in layout units (e.g.cm or inches or any other unit defined). In the map (dataframe) view it will use the coordinate system defined.
The other day I was drawing a simple floor plan to see if some thins would fit. The dataframe had Unknown as coordinate system and when I wanted to measure I couldn't. I decided to select a projected coordinate system and my graphics disappeared. I was able to find them zooming out a lot, but they were all screwed up and most didn't show.
What I mean to say is that having a correct coordinate system is very important. However, if you already have data in the dataframe and they show correctly, the graphics drawn should show.
Could you include a screen shot of what you see (are the handles of the graphic visible after drawing)?
- Mark as New
- Bookmark
- Subscribe
- Mute
- Subscribe to RSS Feed
- Permalink
- Report Inappropriate Content
Hi Xander,
I think the coordinate system is ok; all other data is displaying & behaving correctly. Attached is a screen grab - I used the circle tool and drew a circle; when I finish the handles are visible but not the circle.
thanks.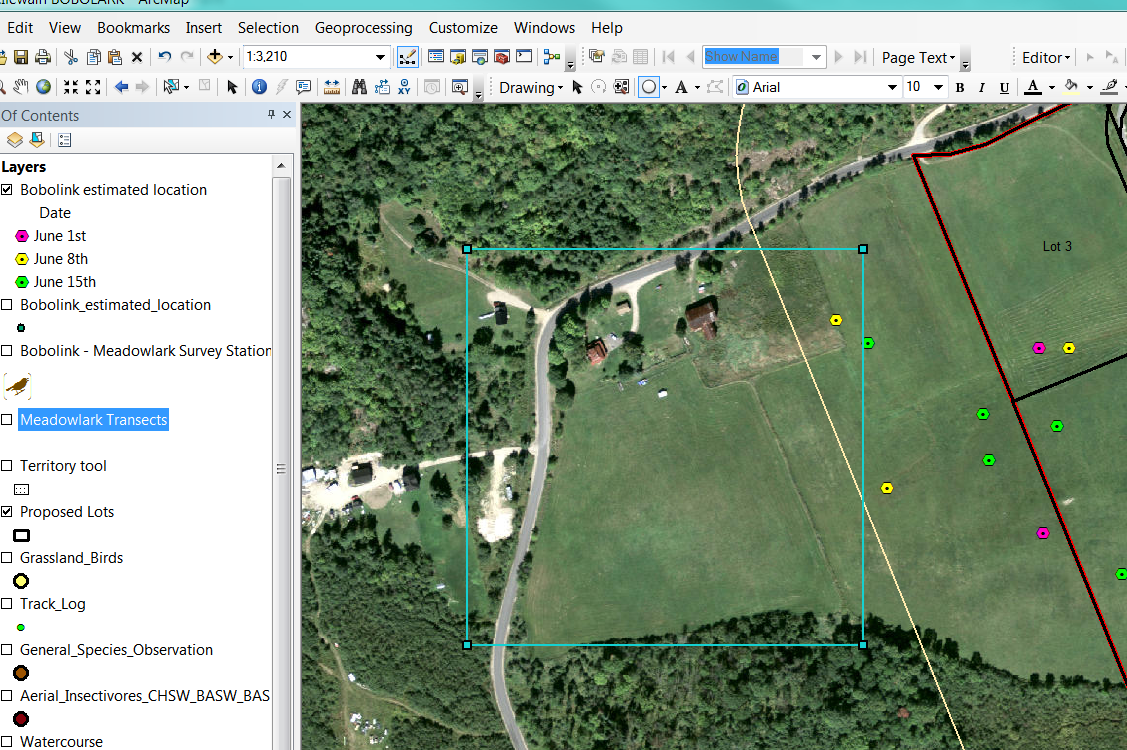
- Mark as New
- Bookmark
- Subscribe
- Mute
- Subscribe to RSS Feed
- Permalink
- Report Inappropriate Content
So under "Drawing" dropdown - what is the active annotation group, and is it turned on?
- Mark as New
- Bookmark
- Subscribe
- Mute
- Subscribe to RSS Feed
- Permalink
- Report Inappropriate Content
default is now but I suppose it wasn't. Funny how the simplest things cause such frustration! Thanks again for your help
- Mark as New
- Bookmark
- Subscribe
- Mute
- Subscribe to RSS Feed
- Permalink
- Report Inappropriate Content
Also, check to make sure the data frame's "target" annotation group is set to be visible. To do this, open the Data Frame properties, Annotation Groups tab and make sure the checkbox next to the annotation group name is checked on.
You can check to see which Annotation Group is the target for drawing by going to the Draw toolbar, Drawing menu, Active Annotation Target pullright.