- Home
- :
- All Communities
- :
- Developers
- :
- Python
- :
- Python Questions
- :
- 6,000+ rasters the follow-up
- Subscribe to RSS Feed
- Mark Topic as New
- Mark Topic as Read
- Float this Topic for Current User
- Bookmark
- Subscribe
- Mute
- Printer Friendly Page
6,000+ rasters the follow-up
- Mark as New
- Bookmark
- Subscribe
- Mute
- Subscribe to RSS Feed
- Permalink
- Report Inappropriate Content
Hi Dan,
That's brilliant! It sounds much easier than the previous approach. I have zipped four months' worth of data if you want to play with it. Let me know if you want me to upload some more.
I must say I am not familiar at all with arrays, would you mind pointing me to some additional information ? And possibly copy the start of a script?
Much appreciated!
- Mark as New
- Bookmark
- Subscribe
- Mute
- Subscribe to RSS Feed
- Permalink
- Report Inappropriate Content
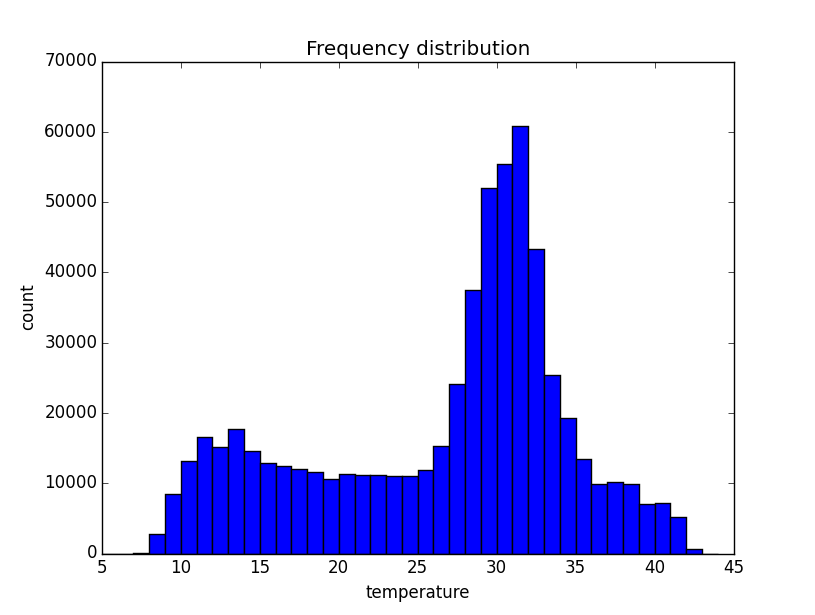
Ok... just let me get organized today, and I will have a working set for you. Can you articulate what statistics your want, for what time sequences (ie weekly, monthly, running means, annualized) and do you want just the stats and/or maps and or histograms like the following. Which I derived from the average of the 5 days you already posted. So you can at least have a look at the histogram for one of those in symbology and compare it relatively to this one...
- Mark as New
- Bookmark
- Subscribe
- Mute
- Subscribe to RSS Feed
- Permalink
- Report Inappropriate Content
Ultimately, I am trying to get an average "growing season temperature or GST" which is an average temperature for each day from 1 October to 30 April, over a 30-year period. It is to characterise the variability within a region so the maps are essential.
My idea was to get the average Maximum temperature for that period and the average Minimum temperature for the same period and then get the average.
A GST per year would be ideal but might be tricky to get as it straddles two years e.g. from 1 October 1961 to 30 April 1962.
- Mark as New
- Bookmark
- Subscribe
- Mute
- Subscribe to RSS Feed
- Permalink
- Report Inappropriate Content
I have one month for you to look at the results in the attachment
Currently this is the timing results for what I have so far... reading the monthly data takes 5.5 seconds, calculating the 3 results takes a sip of coffee, and another sip to write them out.
Let me know if the results are correct, I just want to make sure that I calculated the max, avg and min on the correct dimension. I calculated the min, mean and max for each day for the whole area below the time results...
Timing function for... read_folder
['mx19610101.txt', 'mx19610102.txt', 'mx19610103.txt', 'mx19610104.txt', 'mx19610105.txt', 'mx19610106.txt', 'mx19610107.txt', 'mx19610108.txt', 'mx19610109.txt', 'mx19610110.txt', 'mx19610111.txt', 'mx19610112.txt', 'mx19610113.txt', 'mx19610114.txt', 'mx19610115.txt', 'mx19610116.txt', 'mx19610117.txt', 'mx19610118.txt', 'mx19610119.txt', 'mx19610120.txt', 'mx19610121.txt', 'mx19610122.txt', 'mx19610123.txt', 'mx19610124.txt', 'mx19610125.txt', 'mx19610126.txt', 'mx19610127.txt', 'mx19610128.txt', 'mx19610129.txt', 'mx19610130.txt', 'mx19610131.txt']
Results for... read_folder
time taken ...5.534821477e+00 sec.
Timing function for... calc_stats
Results for... calc_stats
time taken ...5.698581223e-02 sec.
Timing function for... write_file
Results for... write_file
time taken ...2.026189804e-01 sec.
>>> s.shape
(691, 886, 31)
>>> s.ndim
3
>>> for i in range(31):
... print("{:>6.3f} {:>6.3f} {:>6.3f}".format(s.min(), s.mean(), s.max()))
...
25.921 30.192 33.996
25.933 30.194 34.139
25.936 30.196 34.311
25.575 30.198 34.483
25.790 30.201 34.655
25.970 30.205 34.776
25.990 30.209 34.897
26.014 30.212 34.986
26.032 30.217 35.077
25.968 30.222 35.137
25.789 30.227 35.196
25.618 30.232 35.236
25.464 30.238 35.285
25.338 30.243 35.313
25.242 30.250 35.342
25.168 30.258 35.370
25.103 30.266 35.379
25.057 30.275 35.396
25.012 30.285 35.394
24.978 30.295 35.391
24.945 30.305 35.378
24.921 30.315 35.364
24.898 30.326 35.318
24.884 30.339 35.191
24.871 30.349 35.017
24.860 30.360 34.833
24.849 30.371 34.661
24.838 30.383 34.519
24.832 30.392 34.396
24.810 30.407 34.308
24.779 30.421 34.307
>>>
PS, can I get permission to use some of this data for writing and teaching purposes?
- Mark as New
- Bookmark
- Subscribe
- Mute
- Subscribe to RSS Feed
- Permalink
- Report Inappropriate Content
- Mark as New
- Bookmark
- Subscribe
- Mute
- Subscribe to RSS Feed
- Permalink
- Report Inappropriate Content
Thanks for that. I somehow get different results. Just looking at the first txt file (mx19610101), I get:
min = 7.829 ; mean = 26.725; max = 45.344.
That's just from reading the Statistics of the grid obtained from the txt file and that seems more realistic for the month of January.
Regarding using the data fro writing/teaching, I'll have to get back to you tonight on that one as it is not freely available data and I just need to make sure it's okay to use
Cheers
- Mark as New
- Bookmark
- Subscribe
- Mute
- Subscribe to RSS Feed
- Permalink
- Report Inappropriate Content
Ok ... I will rearrange the axes so the days are first (ie 31) The min, avg and max were the values for all locations on a day, not the observed minimum for the whole of Aust. That is what I wanted to clear up, so it isn't a problem. You can get the min on any day (location not relevant), min (the average minimum... if that makes sense) and any combination/permutation you want, since the data are all there, it is just a matter of pulling it out. No sweat if the actual data can't be used, I just thought it would be nice for materials on time series and a variety of other things.. Australia is readily recognizable, self-contained and makes a cool map area... I can simply rescale, shift, rotate, what you have posted, translate and trim the data and plunk it in New Brunswick Can. or somewhere else ... real or imaginary. It is just hard to replicate real temporal data. Once you have the pattern, you can make it totally anon. ...but let me know in any event, we are time-shifted, so I should hope to be finished up with the scripts/summaries 12 hours from now for you to check again.
- Mark as New
- Bookmark
- Subscribe
- Mute
- Subscribe to RSS Feed
- Permalink
- Report Inappropriate Content
I branched this to a new discussion for those that are interested in this component and not the original ... or vica versa
I will send stuff later today... that is today Cdn time
- Mark as New
- Bookmark
- Subscribe
- Mute
- Subscribe to RSS Feed
- Permalink
- Report Inappropriate Content
so I have the stats reporting in this fashion:
Timing function for... read_folder
['mx19610401.txt', 'mx19610402.txt', ... snip ... 'mx19610429.txt', 'mx19610430.txt']
Results for... read_folder
time taken ...6.003275519e+00 sec.
Timing function for... calc_stats
Results for... calc_stats
time taken ...5.432958609e-02 sec.
Timing function for... write_stats
Results for... write_stats
time taken ...2.396773786e-01 sec.
Timing function for... write_all
['mx19610401.txt', 'mx19610402.txt', ... snip ... 'mx19610429.txt', 'mx19610430.txt']
Results for... write_all
time taken ...7.070477038e+00 sec.
Day, min, mean, max
00 6.4 28.2 41.6
01 7.9 28.2 40.3
02 12.6 27.8 40.4
... snip ...
28 8.0 24.8 38.1
29 6.9 24.7 38.1
attached are the rest of the months for checking. If ok, then I will send the scripts ... after I have written the lesson plan for them 
- Mark as New
- Bookmark
- Subscribe
- Mute
- Subscribe to RSS Feed
- Permalink
- Report Inappropriate Content
ADDENDUM
It isn't letting me save attachments today... you will have to email me at my profile email so I can email you the zips files
Never mind... it is just slow with no progress bar being given