- Home
- :
- All Communities
- :
- Developers
- :
- Python
- :
- Python Questions
- :
- Re: Natural Language Parsing of Dates into Calenda...
- Subscribe to RSS Feed
- Mark Topic as New
- Mark Topic as Read
- Float this Topic for Current User
- Bookmark
- Subscribe
- Mute
- Printer Friendly Page
Natural Language Parsing of Dates into Calendar Date Format
- Mark as New
- Bookmark
- Subscribe
- Mute
- Subscribe to RSS Feed
- Permalink
- Report Inappropriate Content
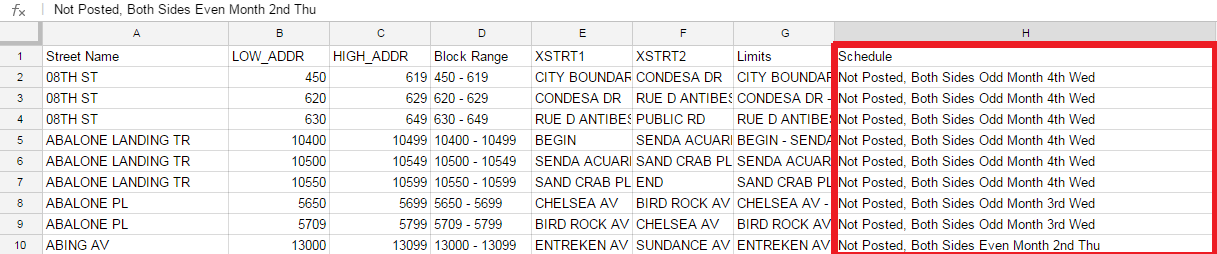
What are good python code samples/libraries that I could use to parse the Natural Language Parsing of Recurring dates that are in string value (eg. Not Posted, Both Sides Even Month 2nd Thu) into quantified values such as a calendar date (example: "16/04/2015")?
Objective:
I want to parse a data field in a street sweeping schedule data table. The data field contains recurring dates in the natural language: eg. "Not Posted, Both Sides Even Month 2nd Thu" into a numerical data format for further processing in the Field Calculator.
The output field that I want to create will tell me the "x number of days since street was last swept".
Purpose:
I wish to statistically study whether there is a correlation between street sweeping and the coastal water quality values. I have the water quality data in the form of on-site collected data and satellite remote sensed data, but in order to examine the correlation between these two variables, I'll need to parse the aforementioned data field with a given a "sample date".
Input output:
"water data collection date" > python parsing tool > "x number of days since street was last swept"
This code will be available for public use on GitHub:
Python code on GitHub: phoenixar/StreetSweepingScheduleParser · GitHub
I am new to GitHub and python coding, so please contact me via reply to this discussion thread.
Please feel free to start "issue threads" on GitHub!
Message was edited by: Dan Patterson Edited to form a discussion
- Mark as New
- Bookmark
- Subscribe
- Mute
- Subscribe to RSS Feed
- Permalink
- Report Inappropriate Content
Do the spreadsheets contain additional date related information? In your example, how did you determine the month and the year? I don't see that data encoded anywhere in the columns listed. I'm also not sure you really need any actual NLP software to do this analysis, you're probably better off starting with a robust date parser, like say bear/parsedatetime · GitHub or https://labix.org/python-dateutil, and using that to generate the dates. You'd still need more information than what's in the spreadsheet, since it doesn't include information about the year, but should help with figuring out the relative date given the year and month.
- Mark as New
- Bookmark
- Subscribe
- Mute
- Subscribe to RSS Feed
- Permalink
- Report Inappropriate Content
Thank you for the links to the Date parsing code (parsedatetime, and python-dateutil)!
python-dateutil has awesome documentation. I can already see the functions that I'll use for that.
I'm pretty sure i'll use the code from parsedatetime as well.
Response to your questions:
Re: the spreadsheet. The spreadsheet only contains the recurring date information as posted on the street signs. Re: the date to compare the recurring data from -- that date will come from another data source: the satellite image date of capture. eg. "Landsat 8 date 18Mar2015.tiff"
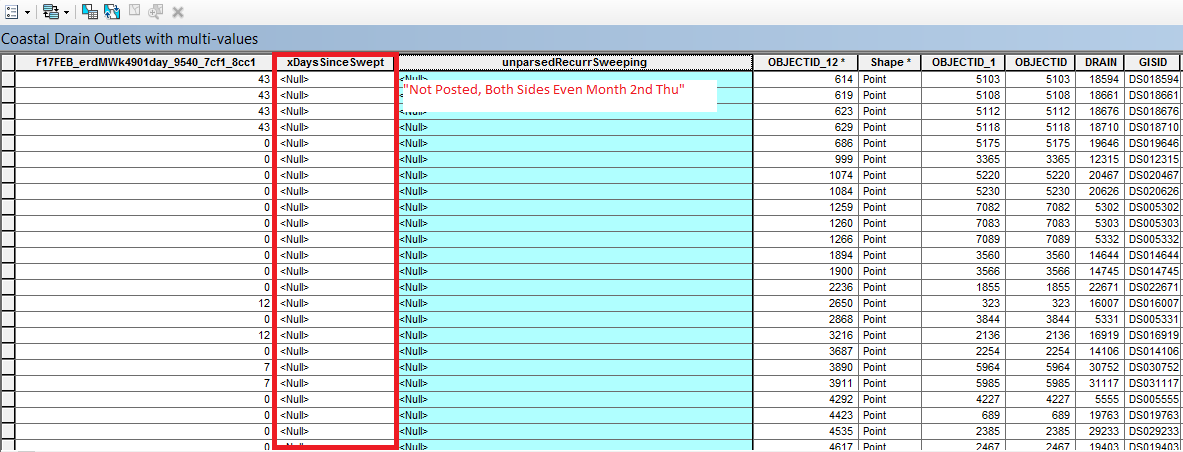
The function will have two parameters: (satellite image date-stamp, street sweeping recurring schedule string). The parameters will come together in a storm drain feature class that I created to model the connection between the two variables. The storm drain data table will have a "water quality data field" and the "recurring street sweeping schedule" data field. (optional) for details on the ArcMap model see: report in pdf.
So far, my pseudocode looks like this:
#import arcpy
#import python date parsing libraries
#setup the workspace environment -
#env 'storm drain inlet' feature class (contains fields: "water quality (from satellite image)" )
#Enter code
#set cursor "storm drain inlet"
#parse date-stamp of satellite image from satellite image file name (this will be an exact date on the calendar)
#create a new field to collect "x days since street was swept" + "satellite image date-stamp"
#parse recurring schedule text string
#calculate latest date in which the street sweeping was done (new project function)
#calculate the delta = date the satellite image was captured (water quality date-stamp) - last date that the street was swept (from street sweeping schedule spreadsheet)