- Home
- :
- All Communities
- :
- Products
- :
- Spatial Statistics
- :
- Spatial Statistics Questions
- :
- Plot Correlation coefficient along with Significan...
- Subscribe to RSS Feed
- Mark Topic as New
- Mark Topic as Read
- Float this Topic for Current User
- Bookmark
- Subscribe
- Mute
- Printer Friendly Page
Plot Correlation coefficient along with Significant Value in Arc GIS 10.3
- Mark as New
- Bookmark
- Subscribe
- Mute
- Subscribe to RSS Feed
- Permalink
- Report Inappropriate Content
Hi All,
I am working on two raster datasets, one raster is co-relation coefficient and another one is the significance of correlation.
I want to plot significance of correlation raster as a point, where the significance value more than > 90 % then it will create point feature on base map.
Meanwhile, here base map will be co-relation coefficient raster and significant of correlation raster will overlay as a pattern feature where > 90 significance value, then it will make point feature on the correlation raster. Below i am showing the images what i am trying to do,
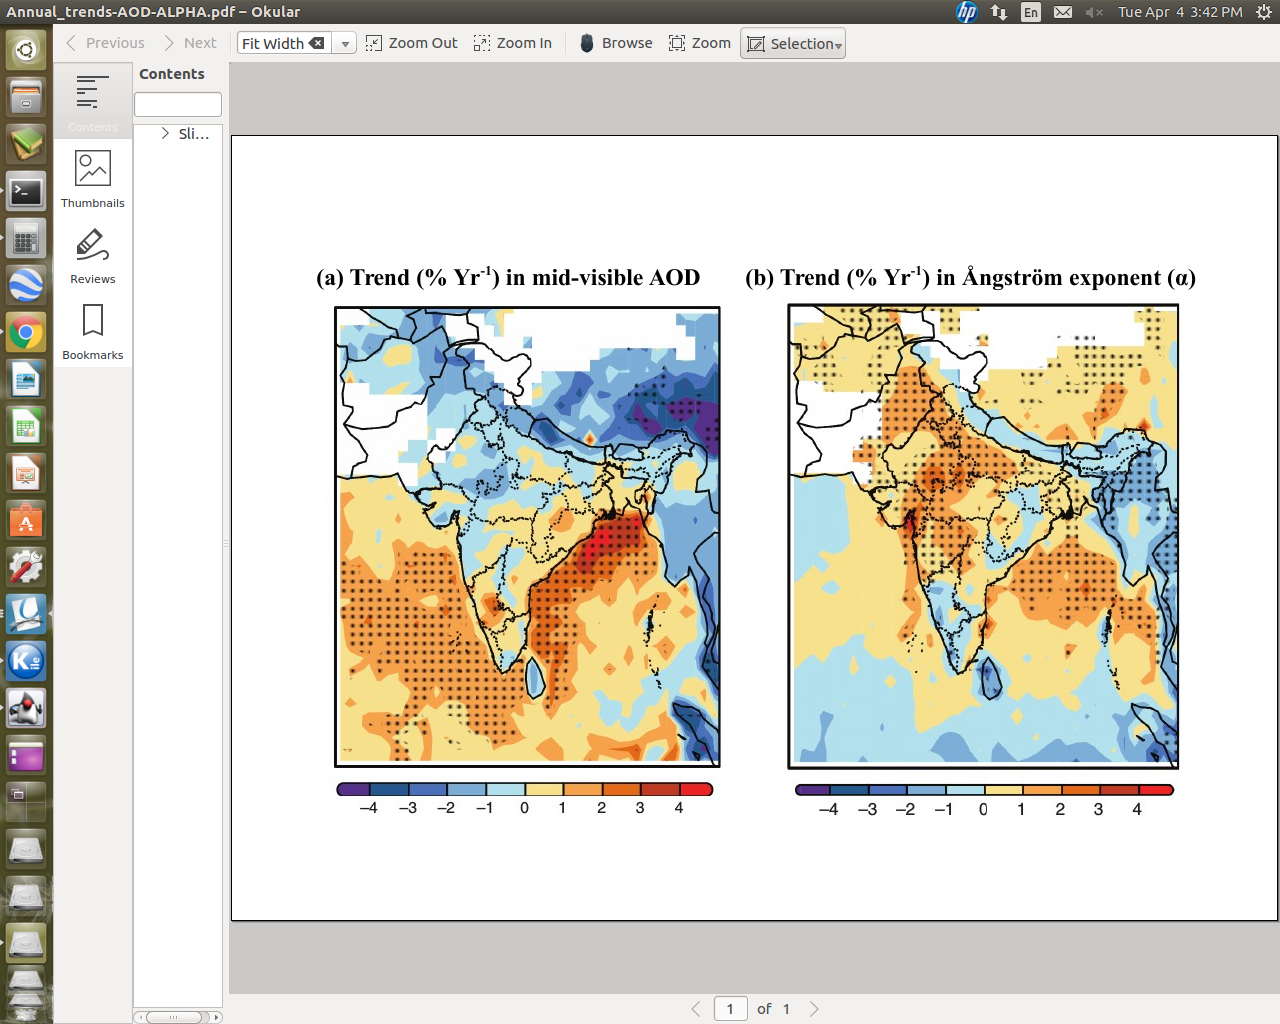
Above image shows correlation coefficient along with significant value (By balck doted), where significant value > 90 , then point will create automatically else no point will create.
Thank you